Dogecoin price disappoints on “DogeDay” but is still poised for a 50% rally
- Dogecoin price pattern has transformed into a symmetrical triangle.
- IOMAP data does show some resistance just above current price.
- A reminder, DOGE is not a token powering a fundamental network like ETH.

Dogecoin price fever is set to continue as the popular cryptocurrency forms a symmetrical triangle pattern on the intra-day charts. A couple more oscillations may be necessary to complete the continuation pattern, but DOGE is readying to print new highs later this week.
Dogecoin price may need more social media tricks to propel it higher
On a bearish note, the latest Intotheblock In/Out of the Money Around Price (IOMAP) data does show a wall of resistance between $0.3426 and $0.3522, where 63.57k addresses bought $9.4 billion DOGE. Meanwhile, the data shows little support down to the 50 four-hour simple moving average (SMA).
The IOMAP data suggests that the upside will be contained to the mid-point of the pattern in the short term, and there could be another test of the triangle’s lower trend line before price resumes higher.
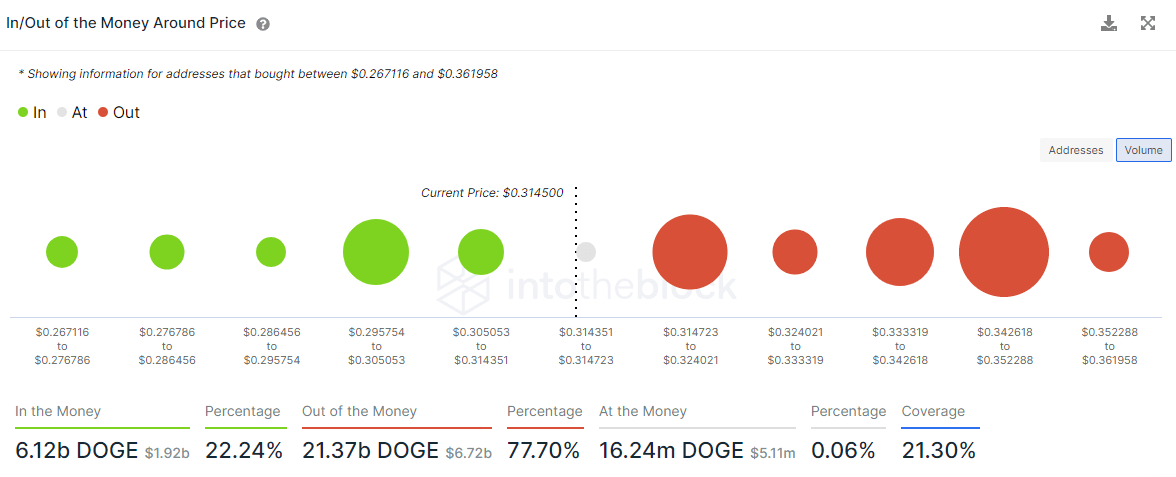
DOGE IOMAP data
Until yesterday, Dogecoin price was forming a clear cup-with-handle pattern on the intra-day charts, and the altcoin appeared primed to break out into new highs. However, the pattern has now evolved into a symmetrical triangle pattern with a measured move potential of 50% from the triangle’s upper trend line and a 100% gain from the current price. The measured move equals a price of $0.6294.
Some earlier resistance may occur at the 127.2% Fibonacci extension of the weekend crash at $0.5461. If DOGE discards with $0.6294, speculators need to look to the 161.8% extension at $0.6910 as a new profit target.
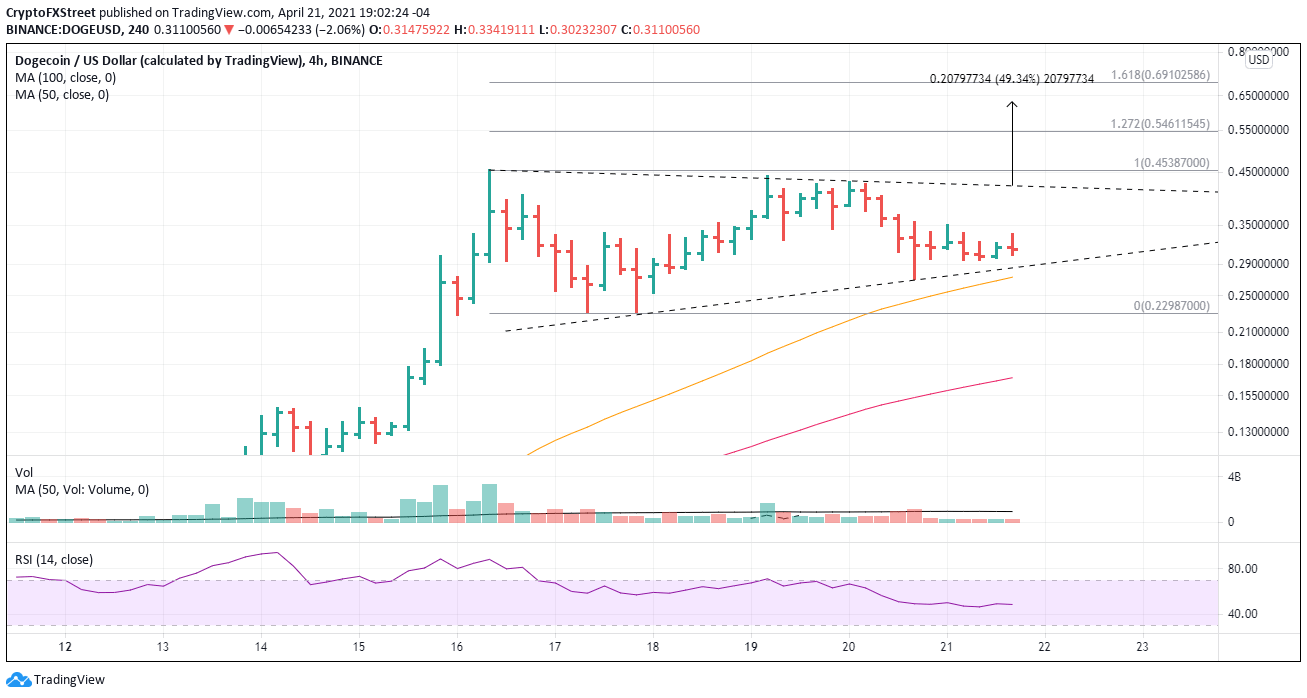
DOGE/USD 4-hour chart
Dogecoin price moves are often sudden, so it is crucial to monitor intra-day movements. A decline below $0.2699 will void the current triangle and raise the probability of a test of $0.2298. Significant losses await a failure at the April 17 low.
Author

Sheldon McIntyre, CMT
Independent Analyst
Sheldon has 24 years of investment experience holding various positions in companies based in the United States and Chile. His core competencies include BRIC and G-10 equity markets, swing and position trading and technical analysis.


