- Dogecoin gets ready for a massive upswing to $0.09 despite the barrier at $0.05.
- The increased social buzz around Dogecoin could see investor sentiment grow.
- The IOMAP reveals that robust seller congestion may hinder the expected upsurge.
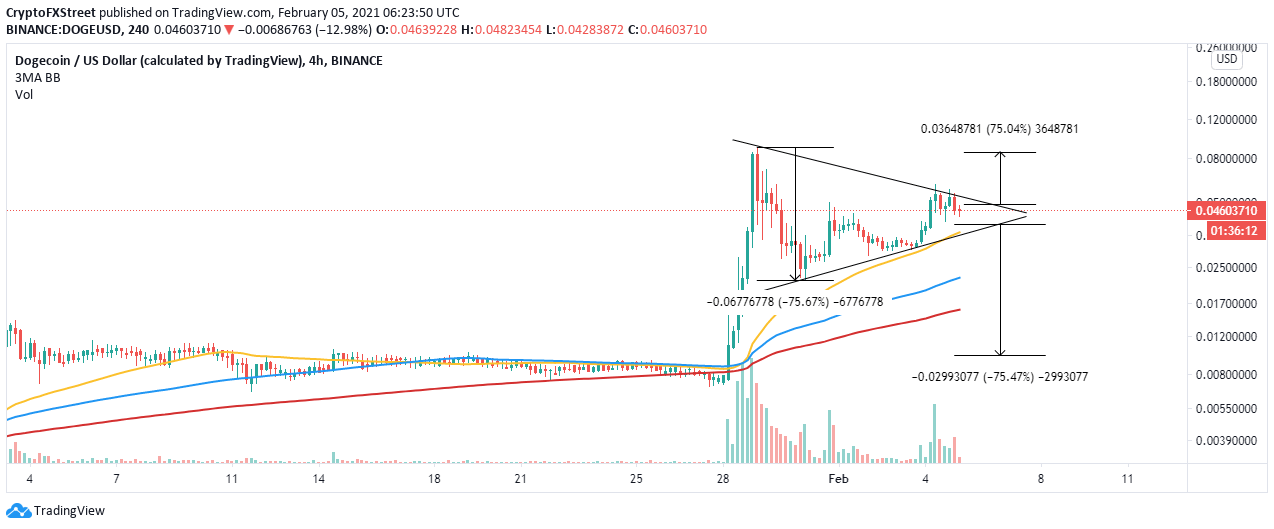
Dogecoin continues to stir interest across the cryptocurrency market. Speculation shoot up after a tweet by Elon Musk, the founder of Tesla. At the time of writing, DOGE is trading at $0.046 after hitting a barrier at $0.055. Support is needed to place the ‘Meme Coin’ back on the recovery trajectory eyeing $0.09.
Dogecoin must flip crucial resistance into support to sustain the uptrend
DOGE is dancing at the apex of a symmetrical triangle. The pattern is created by connecting a series of lower highs with a trendline. Similarly, the asset’s higher lows are linked using another trendline.
Traders usually lookout for breakouts or breakdowns from the triangle. A breakout occurs after the price slices through the upper trendline. In the case of Dogecoin, a 75% upswing may come into action if the price rises above the pattern. Triangles are essential in trend prediction because they have exact price targets measured from the highest to lowest points.
DOGE/USD 4-hour chart
According to the Santiment, Dogecoin’s social media-related mentions have started to increase consistently after falling massively early this week. An increase in social volume is a bullish signal and foresees a price rise. However, it is essential to watch out for the peak as it quickly turns bearish.
Dogecoin social volume
Looking at the other side of the fence
The IOMAP model by IntoTheBlock brings to light a strong resistance that could derail the upswing. This seller congestion zone runs from $0.046 to $0.048. Here, roughly 49,000 addresses had previously purchased nearly 9.4 billion DOGE. The investors in this range will be trying to come out of their positions, adding to the selling pressure.
Dogecoin IOMAP chart
On the downside, support exists but not as strong as the above resistance. Therefore, bulls must push for gains above $0.05 to avert potentially massive losses. Besides, the symmetrical triangle pattern suggests that a breakdown may extend to $0.0096.
The 50 Simple Moving Average, the 100 SMA, and the 200 SMA are in line to absorb the selling, thus preventing a sharp price drop.
Information on these pages contains forward-looking statements that involve risks and uncertainties. Markets and instruments profiled on this page are for informational purposes only and should not in any way come across as a recommendation to buy or sell in these assets. You should do your own thorough research before making any investment decisions. FXStreet does not in any way guarantee that this information is free from mistakes, errors, or material misstatements. It also does not guarantee that this information is of a timely nature. Investing in Open Markets involves a great deal of risk, including the loss of all or a portion of your investment, as well as emotional distress. All risks, losses and costs associated with investing, including total loss of principal, are your responsibility. The views and opinions expressed in this article are those of the authors and do not necessarily reflect the official policy or position of FXStreet nor its advertisers. The author will not be held responsible for information that is found at the end of links posted on this page.
If not otherwise explicitly mentioned in the body of the article, at the time of writing, the author has no position in any stock mentioned in this article and no business relationship with any company mentioned. The author has not received compensation for writing this article, other than from FXStreet.
FXStreet and the author do not provide personalized recommendations. The author makes no representations as to the accuracy, completeness, or suitability of this information. FXStreet and the author will not be liable for any errors, omissions or any losses, injuries or damages arising from this information and its display or use. Errors and omissions excepted.
The author and FXStreet are not registered investment advisors and nothing in this article is intended to be investment advice.
Recommended Content
Editors’ Picks
Bitcoin price could retrace to $42,000 if US Nonfarm Payroll comes in at 180,000

Bitcoin price just like other assets, is highly impacted by the macro-financial developments. This includes the Nonfarm Payrolls (NFP) report released by the BLS of the United States. This time around, the NFP data is expected to cause a dip in the value of BTC.
Ripple is now only 3% away from becoming a bigger entity than Binance Coin
Ripple has overcome a lot of obstacles on its way to becoming the world’s fifth-largest cryptocurrency, as witnessed by the recent rise in XRP price. The native token of the world’s biggest crypto exchange, Binance Coin, on the other hand, has been moving in the opposite direction.
Ethereum leads altcoins north as Bitcoin halts amid bull trap fears

Ethereum (ETH) price remains northbound, unrelenting despite the king of cryptocurrency, Bitcoin, showing weakness. Behavior analytics tool Santiment observes that Ether and altcoins are on a tear even as BTC momentum fades.
BTC headstrong as Spot ETF talks reach technical stage

Bitcoin remains steadfast on the higher timeframe, amid news that spot BTC exchange-traded funds (ETF) discussions are now at the technical stage of approval. Specifically, talks with Spot BTC ETF issuers have advanced to key technical details, with Reuters indicating that it could signal a shift toward a potential approval.
Analyzing potential $30k corrections ahead of BTC ETF approval

Bitcoin has slowed down its 2023 bull rally as it approaches the $37,000 level. After three weeks of consolidating around this level, BTC shows no directional bias whatsoever. Some investors speculate this could be an upward-sloping accumulation that leads to a $40,000 rally.