Dogecoin Price Prediction: DOGE delays its 20% move as volatility disappears
- Dogecoin price lacks volatility as Bollinger Bands tightly envelop it.
- A bullish breach of the no-trade zone extending from $0.056 to $0.059 might see DOGE surge 20% to $0.072.
- An 8% downswing to $0.051 is like if the $0.056 level is breached.

Dogecoin price awaits a clear trend to establish as it trades in a no-trade zone.
Dogecoin price stays lull
Dogecoin price has been trending higher, albeit slowly. At the time of writing, Bollinger Bands are squeezing DOGE, which indicates a lack of volatility and reduced market participants. So long as the meme coin remains within the no-trade zone ranging from $0.056 to $0.059, volatile moves cannot be expected.
However, if Dogecoin price manages to pierce through the upper boundary of this no-trade zone, a bullish narrative could evolve. In this case, DOGE could first surge 8% to $0.064.
A decisive close above this combined with the persistence of buying pressure could further propel the meme coin to $0.072, coinciding with the 127.2% Fibonacci retracement level.
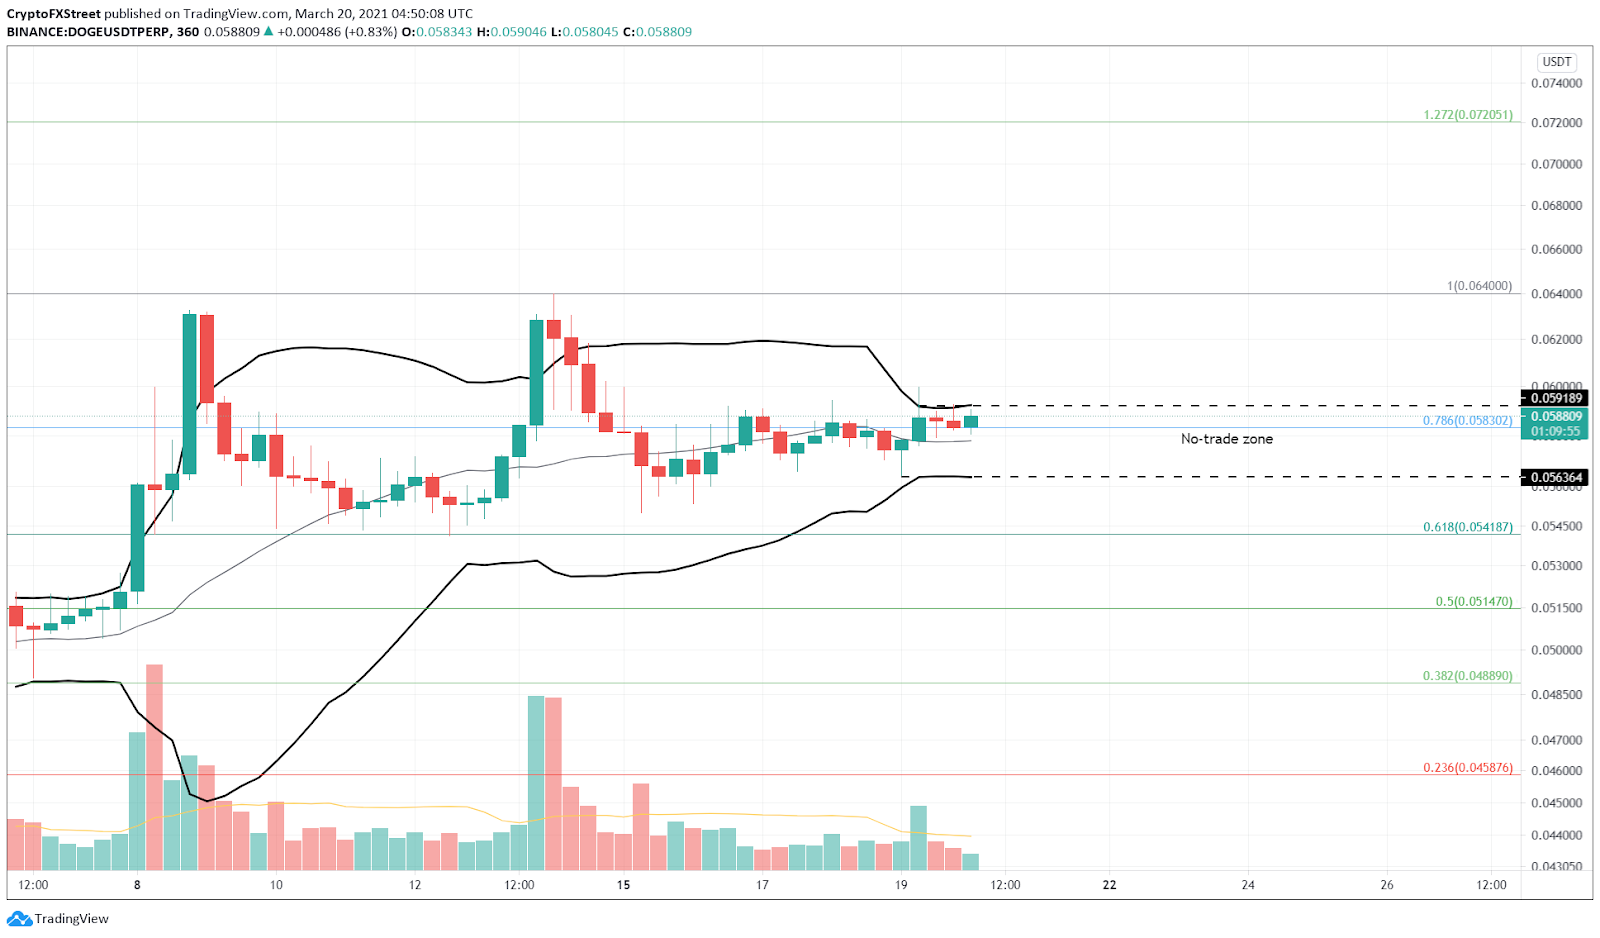
DOGE/USDT 6-hour chart
Adding credence to this optimistic outlook is IntoTheBlock’s In/Out of the Money Around Price (IOMAP) model, which shows a massive demand barrier at $0.057. Here roughly, 180,000 addresses previously purchased a whopping 13 billion DOGE.
Compared to this, the supply barrier at $0.058 is smaller as it harbors roughly 68,000 addresses holding about 8.7 billion DOGE tokens.
Therefore, a spike in bullish momentum could see the resistance at $0.058 breach first. Regardless, only a decisive close above $0.059 will strongly confirm an uptrend.

Dogecoin IOMAP chart
Investors need to keep a close eye on the $0.056 barrier, as a drop below this could potentially trigger cascading sell orders from underwater investors around $0.058.
In such a case, Dogecoin price could drop by 8% to a stable demand barrier around the 50% Fibonacci retracement level at $0.051.
Author

Akash Girimath
FXStreet
Akash Girimath is a Mechanical Engineer interested in the chaos of the financial markets. Trying to make sense of this convoluted yet fascinating space, he switched his engineering job to become a crypto reporter and analyst.



