Dogecoin Price Forecast: DOGE sustains bullish outlook, but surge in supply in profit poses risks
- Dogecoin edges higher on Friday, backed by increase in speculative demand.
- DOGE’s Open Interest hits $3.4 billion, while volume increases to $6.5 billion.
- Dogecoin’s supply in profit rises, adding to the risk of profit taking.
Dogecoin (DOGE) upholds a robust bullish outlook on Friday, as it extends recovery from support at $0.1881 by nearly 19% to trade at around $0.2232 at the time of writing.
This uptick in price is reflected across the crypto market, buoyed by risk-on sentiment. The meme coin sector is edging higher, with the market capitalisation growing over 6% in the last 24 hours to approximately $77 billion.
A steady derivatives market affirms the surge in speculative demand. However, a surge in Dogecoin’s supply in profit suggests that investors may book early profits, dampening the uptrend.
Dogecoin steadies uptrend amid surge in Open Interest, supply in profit
Interest in Dogecoin is expanding, according to CoinGlass derivatives market data. In the last 24 hours, Open Interest (OI), which refers to the notional value of outstanding futures or options contracts, has surged by 6.6% to $3.4 billion. A subsequent increase in the trading volume to $6.5 billion underscores the speculative demand and heightened market activity.
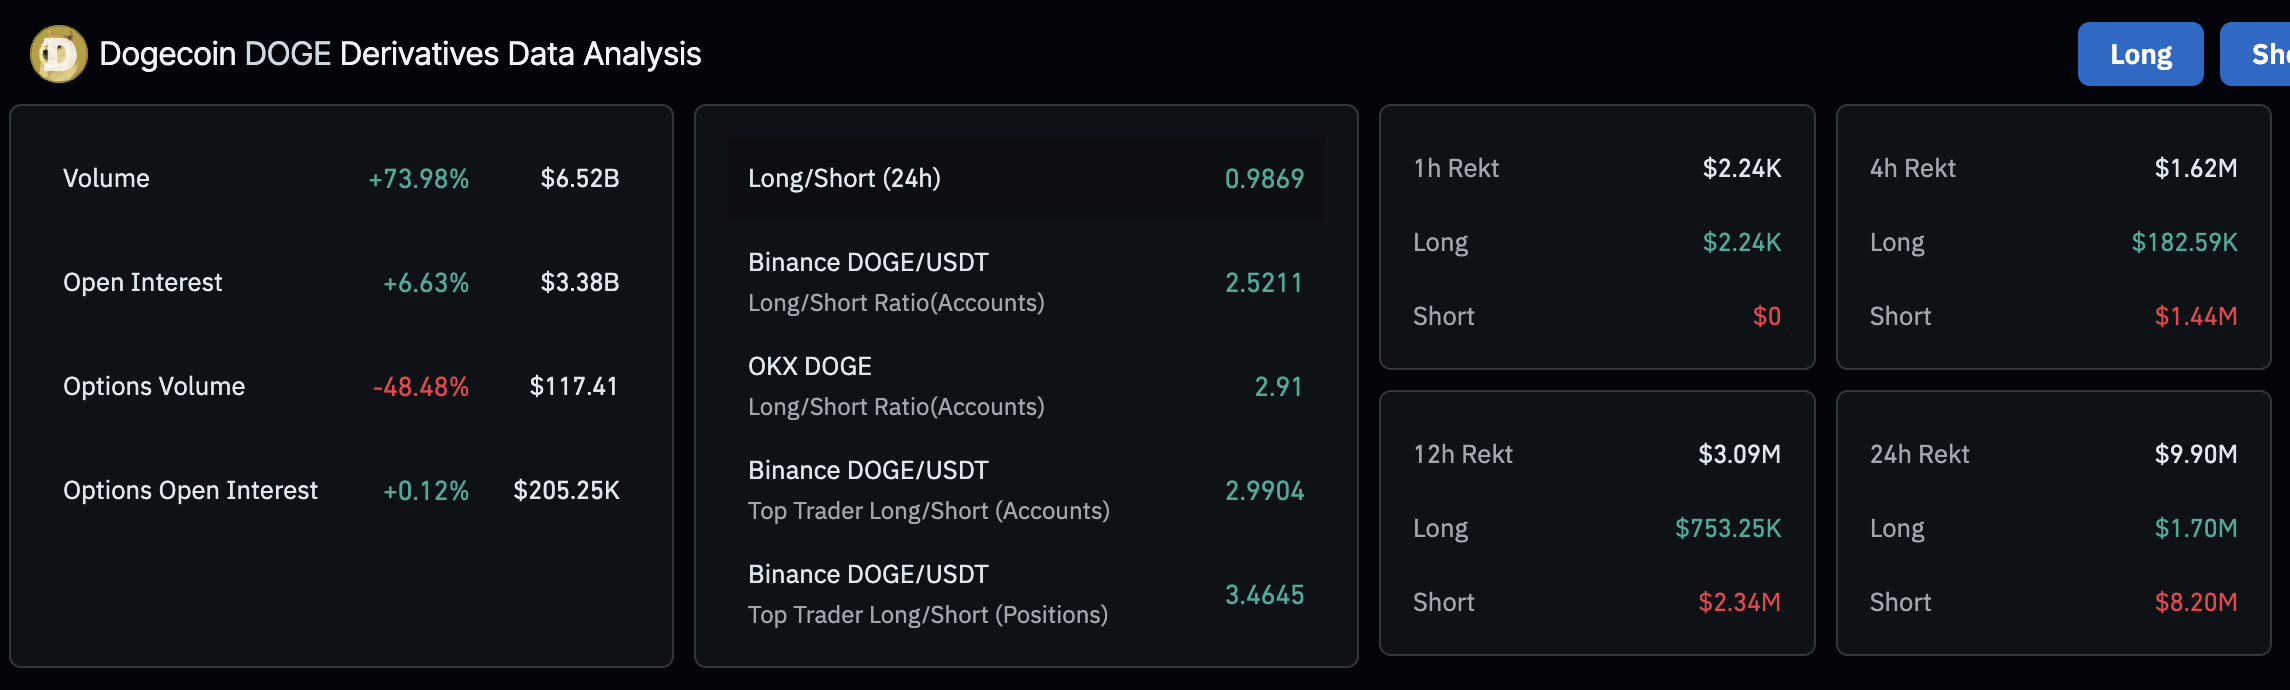
Dogecoin derivatives market data | Source: CoinGlass
Liquidations over the same period amounted to $9.9 million, with the lion’s share accounted for by short position holders at $8.2 million. On the other hand, long position holders faced $1.7 million in liquidations, underpinning the bullish outlook and the increase in Dogecoin price by approximately 4.4% in the past 24 hours.
Meanwhile, Glassnode data shows that Dogecoin’s supply in profit increased 38% in the last month, averaging at 105 billion DOGE at the time of writing. This surge poses a profit-taking risk if investors consider selling.
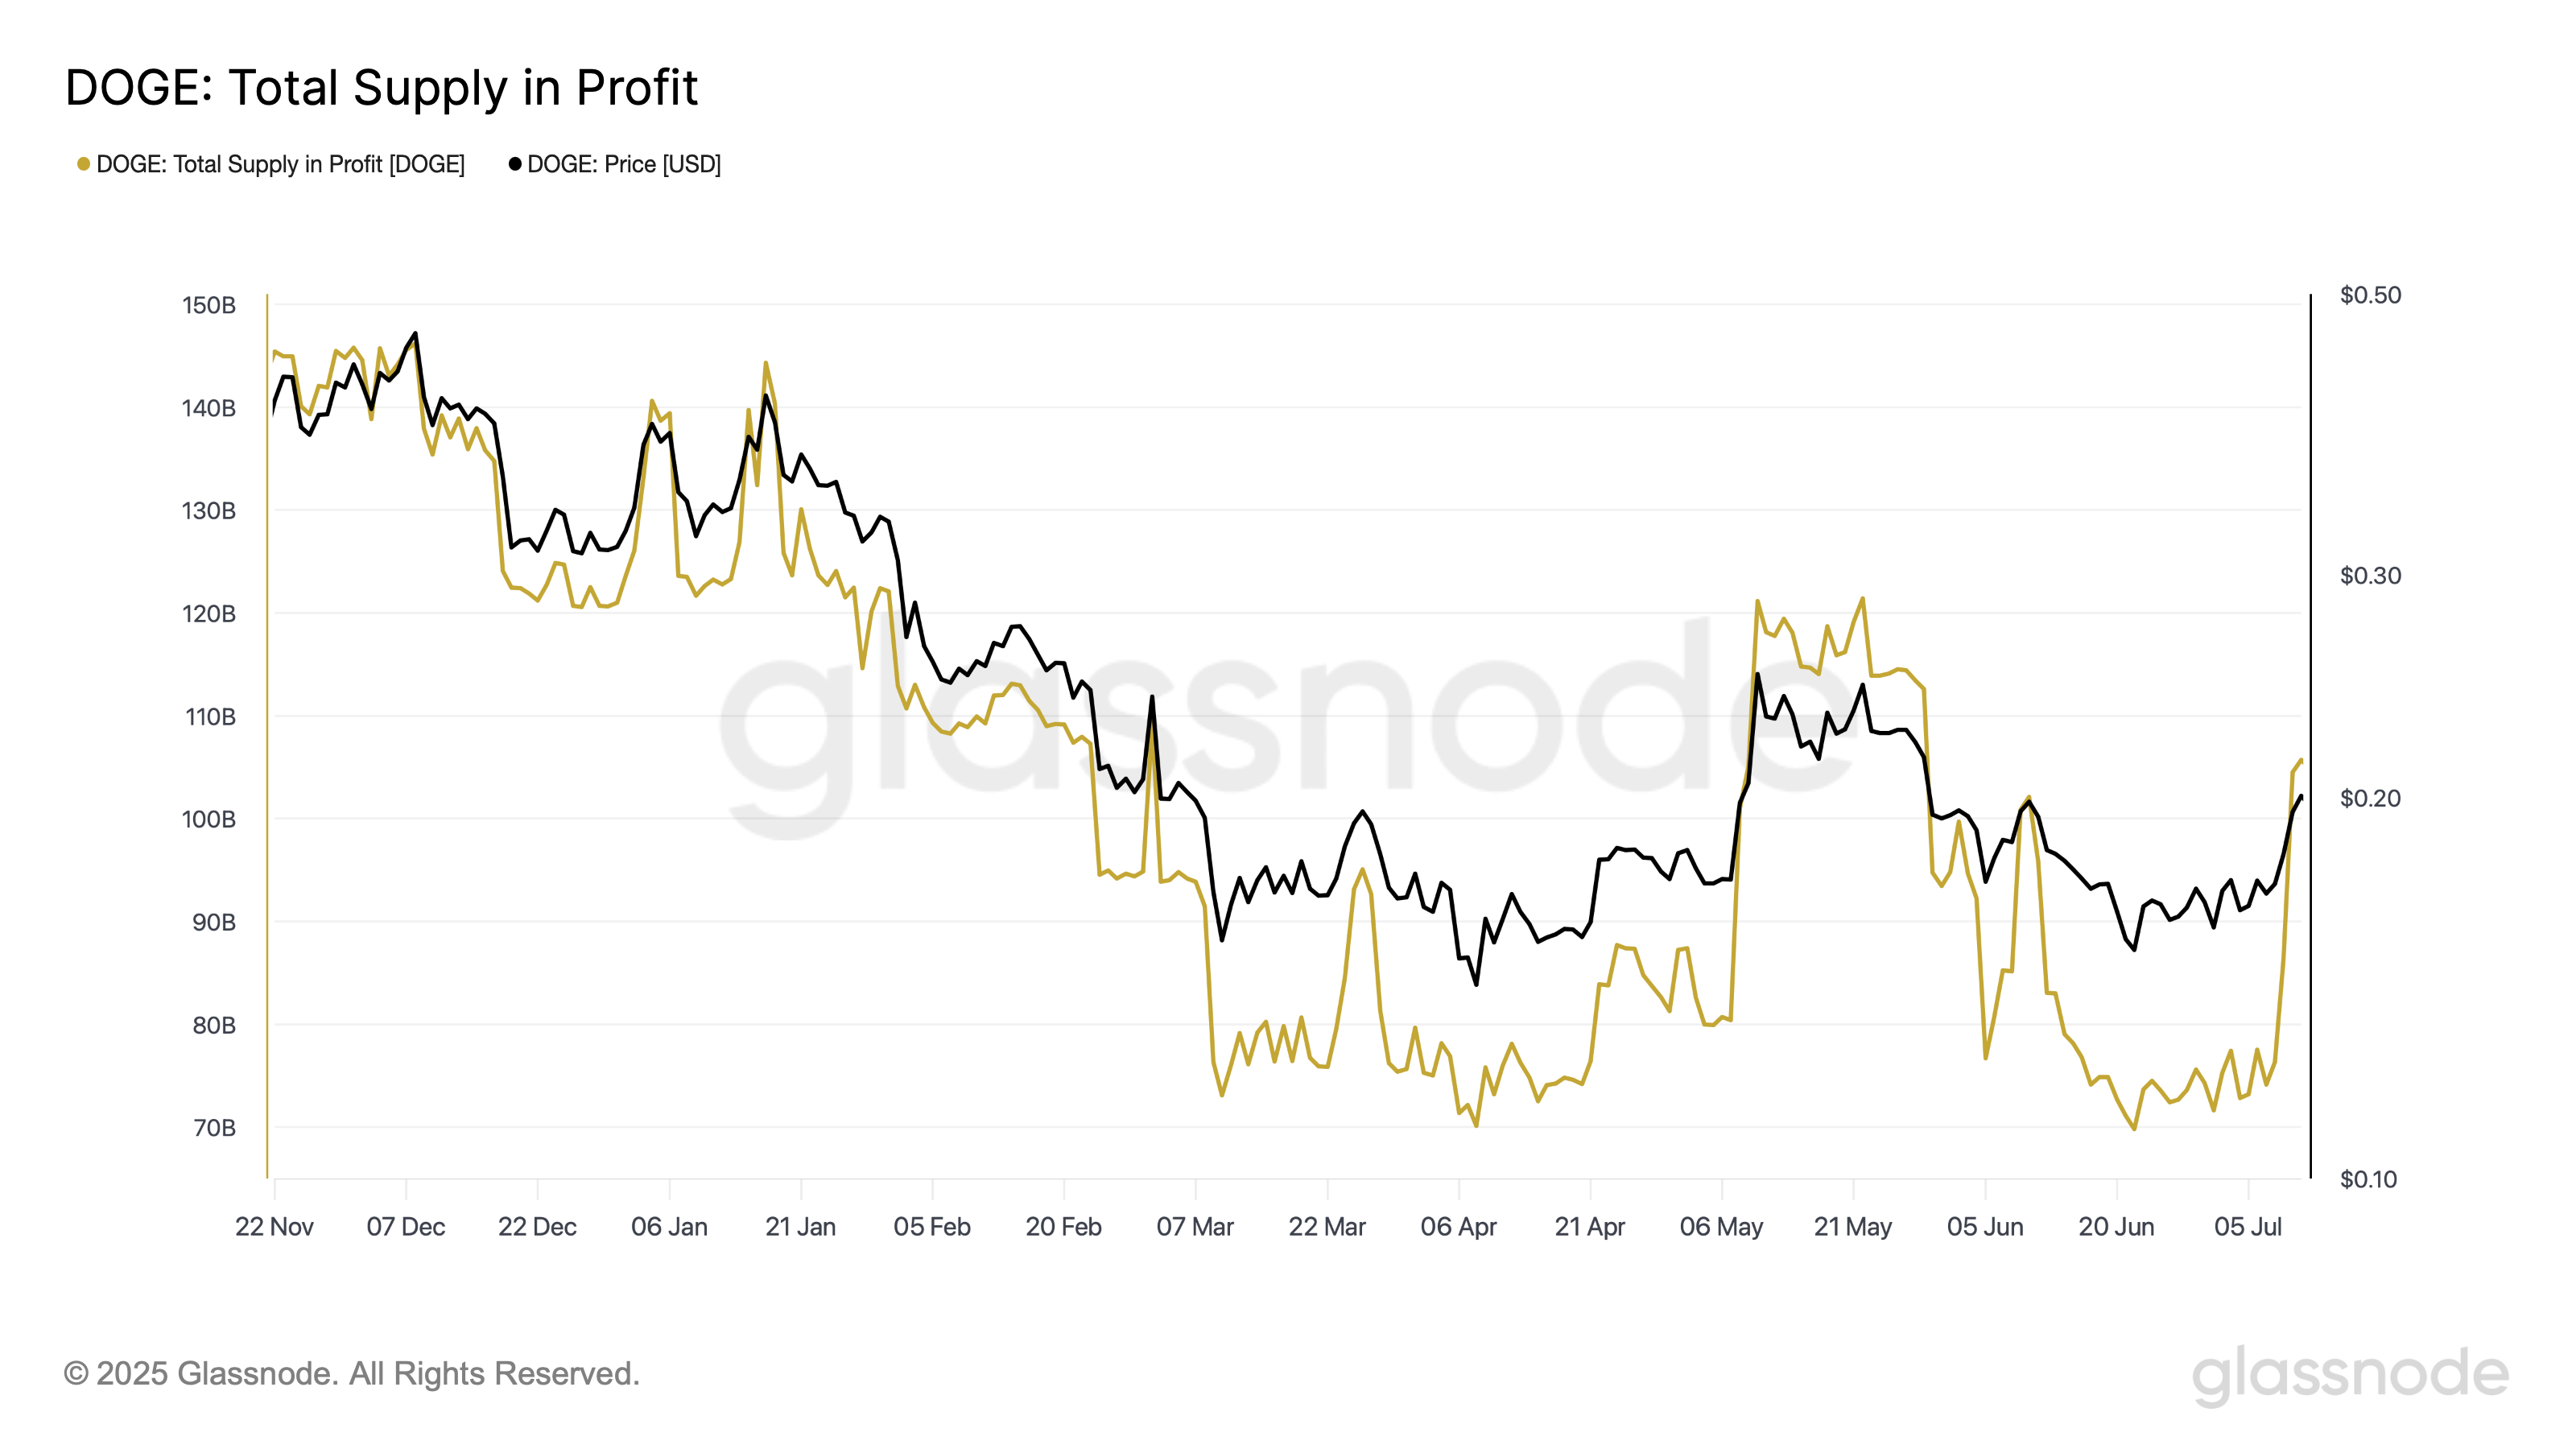
Dogecoin Supply in Profit | Source: CoinGlass
Still, if Dogecoin sustains its technical bullish outlook and retail demand steadies as reflected by the derivatives market data, the uptrend could extend toward the July peak of $0.2871.
Technical outlook: DOGE bulls tighten grip
Dogecoin price holds significantly above the 50-day Exponential Moving Average (EMA), which has formed a confluence support with the 200-day EMA at around $0.2075 and the 100-day EMA at $0.2033.
The Relative Strength Index (RSI) recovery above the midline bolsters the bullish outlook, indicating that buying pressure is steady. Meanwhile, the Moving Average Convergence Divergence (MACD) shows signs of confirming a buy signal on the daily chart if the blue line crosses above the red signal line.
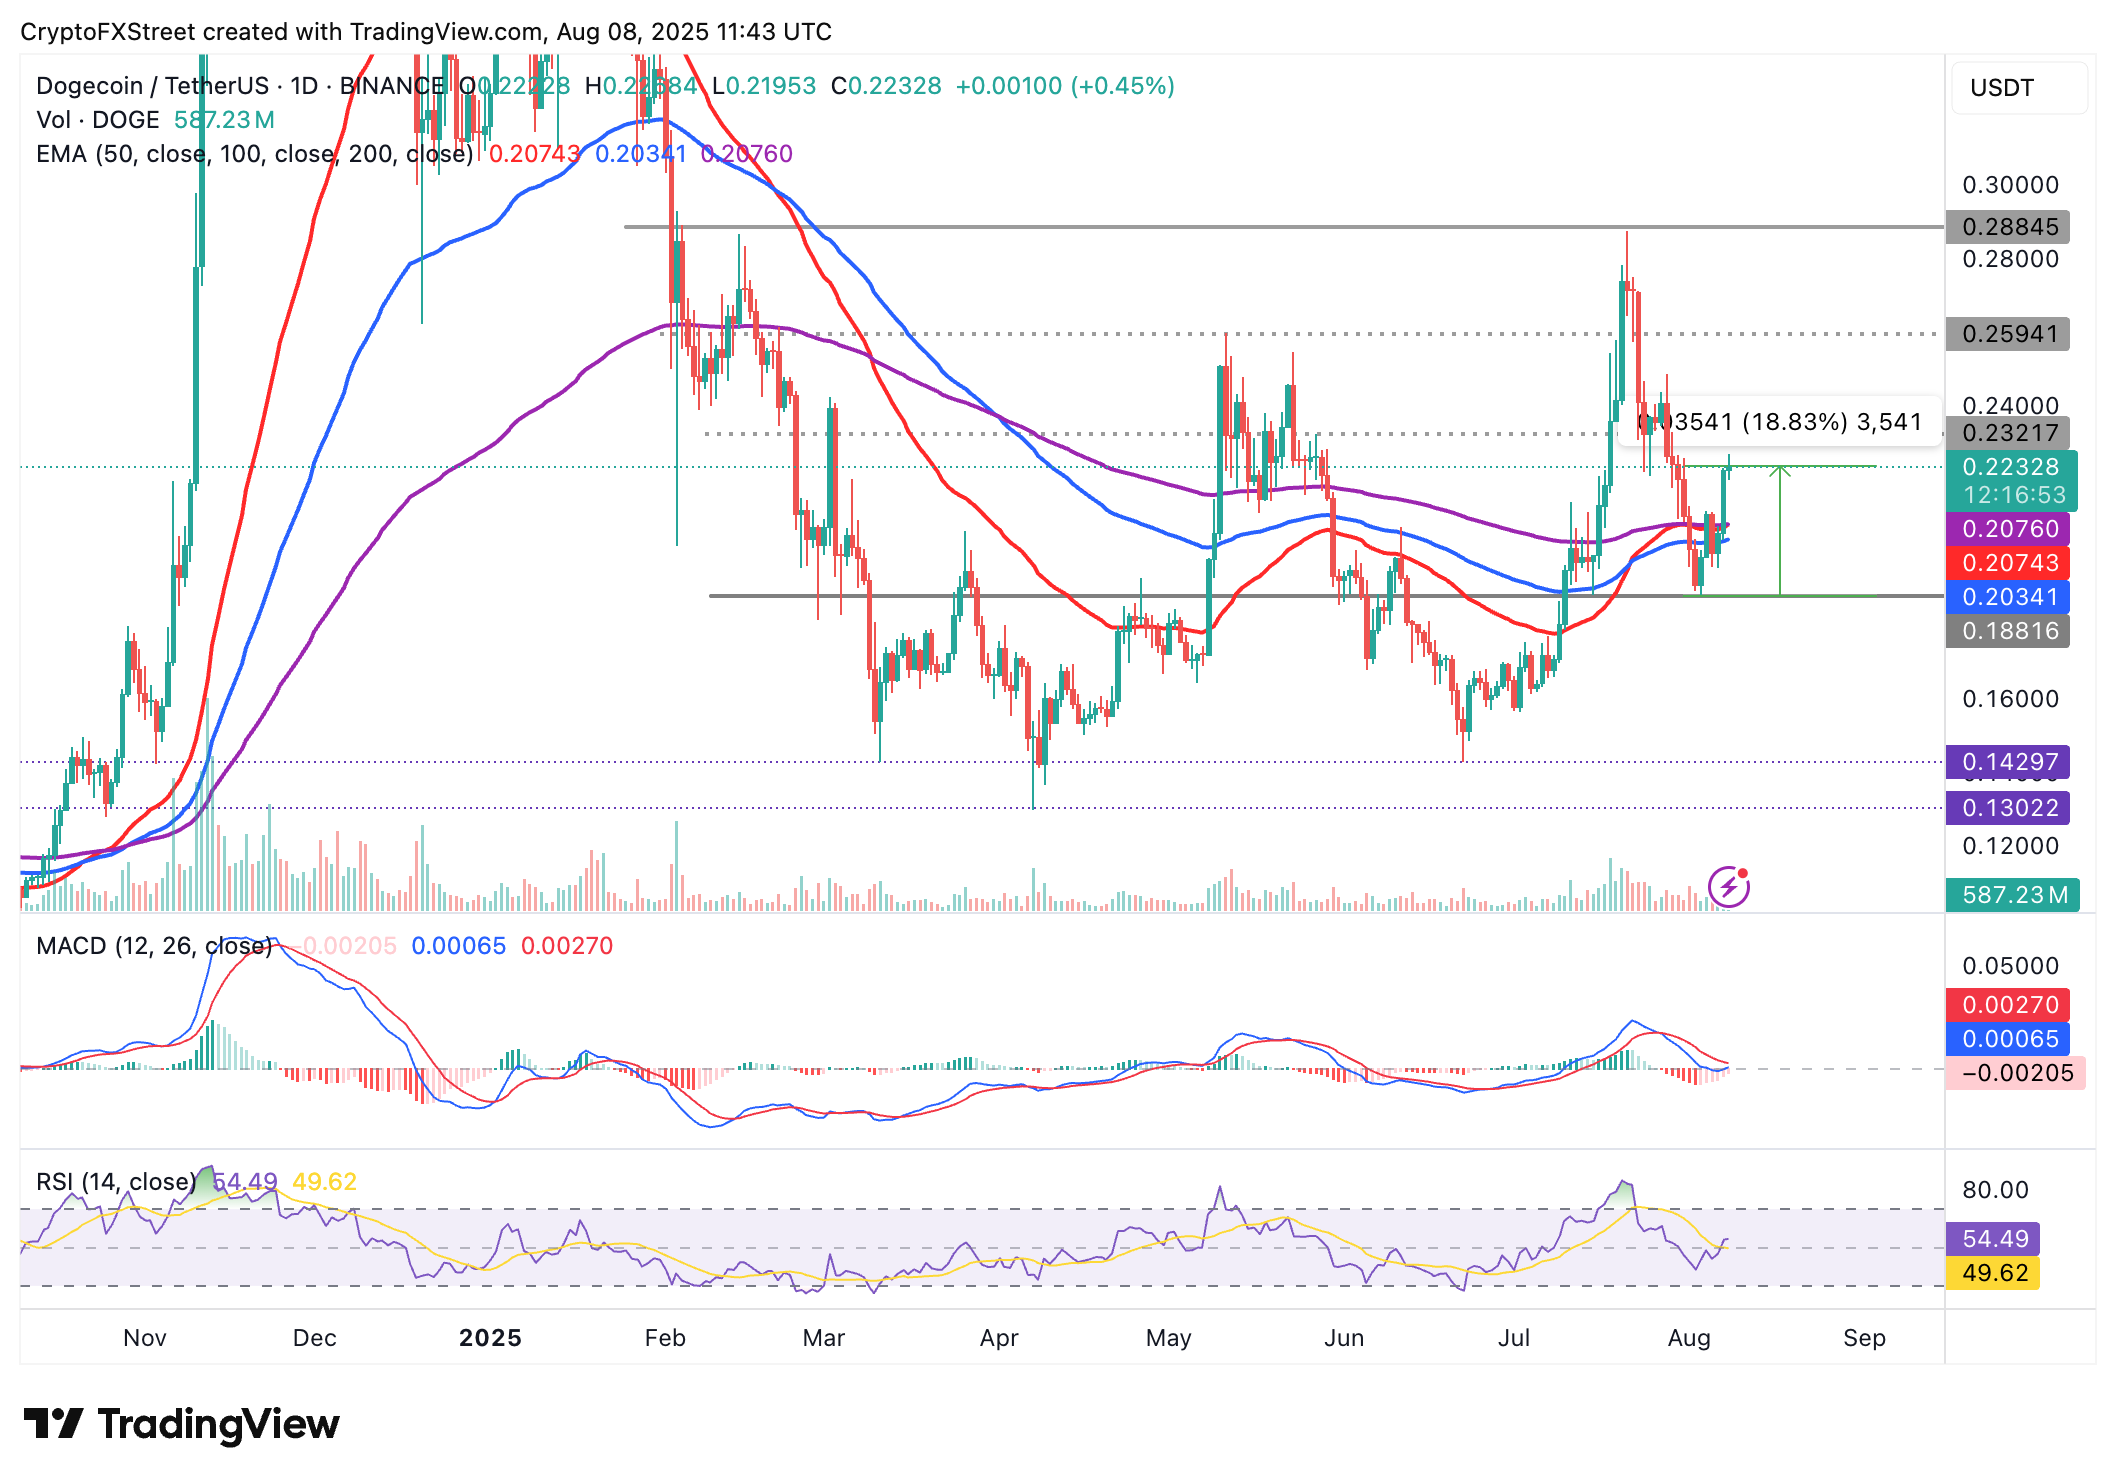
DOGE/USDT daily chart
Key areas of interest for traders are the tentative support levels at $0.2200, the confluence formed at around $0.2075 and the buyer congestion zone at around $0.1881, tested on Sunday. Critical milestones include the resistance at $0.2317, which was tested on May 27, the seller congestion at $0.2594, tested on May 11 and the July peak of $0.2871.
Cryptocurrency metrics FAQs
The developer or creator of each cryptocurrency decides on the total number of tokens that can be minted or issued. Only a certain number of these assets can be minted by mining, staking or other mechanisms. This is defined by the algorithm of the underlying blockchain technology. On the other hand, circulating supply can also be decreased via actions such as burning tokens, or mistakenly sending assets to addresses of other incompatible blockchains.
Market capitalization is the result of multiplying the circulating supply of a certain asset by the asset’s current market value.
Trading volume refers to the total number of tokens for a specific asset that has been transacted or exchanged between buyers and sellers within set trading hours, for example, 24 hours. It is used to gauge market sentiment, this metric combines all volumes on centralized exchanges and decentralized exchanges. Increasing trading volume often denotes the demand for a certain asset as more people are buying and selling the cryptocurrency.
Funding rates are a concept designed to encourage traders to take positions and ensure perpetual contract prices match spot markets. It defines a mechanism by exchanges to ensure that future prices and index prices periodic payments regularly converge. When the funding rate is positive, the price of the perpetual contract is higher than the mark price. This means traders who are bullish and have opened long positions pay traders who are in short positions. On the other hand, a negative funding rate means perpetual prices are below the mark price, and hence traders with short positions pay traders who have opened long positions.
Author

John Isige
FXStreet
John Isige is a seasoned cryptocurrency journalist and markets analyst committed to delivering high-quality, actionable insights tailored to traders, investors, and crypto enthusiasts. He enjoys deep dives into emerging Web3 tren



