|

Dogecoin price could mudslide into $0.02 if these technicals are correct

  • DOGE price has printed a large bearish engulfing candle on the daily chart.
  • Dogecoin produced a classic ramping pattern on the volume indicator.
  • Invalidation of the bearish downtrend is a breach of $0.115

Dogecoin price is set to destroy long-term investors' morale in the coming weeks.

Dogeprice to $0.02

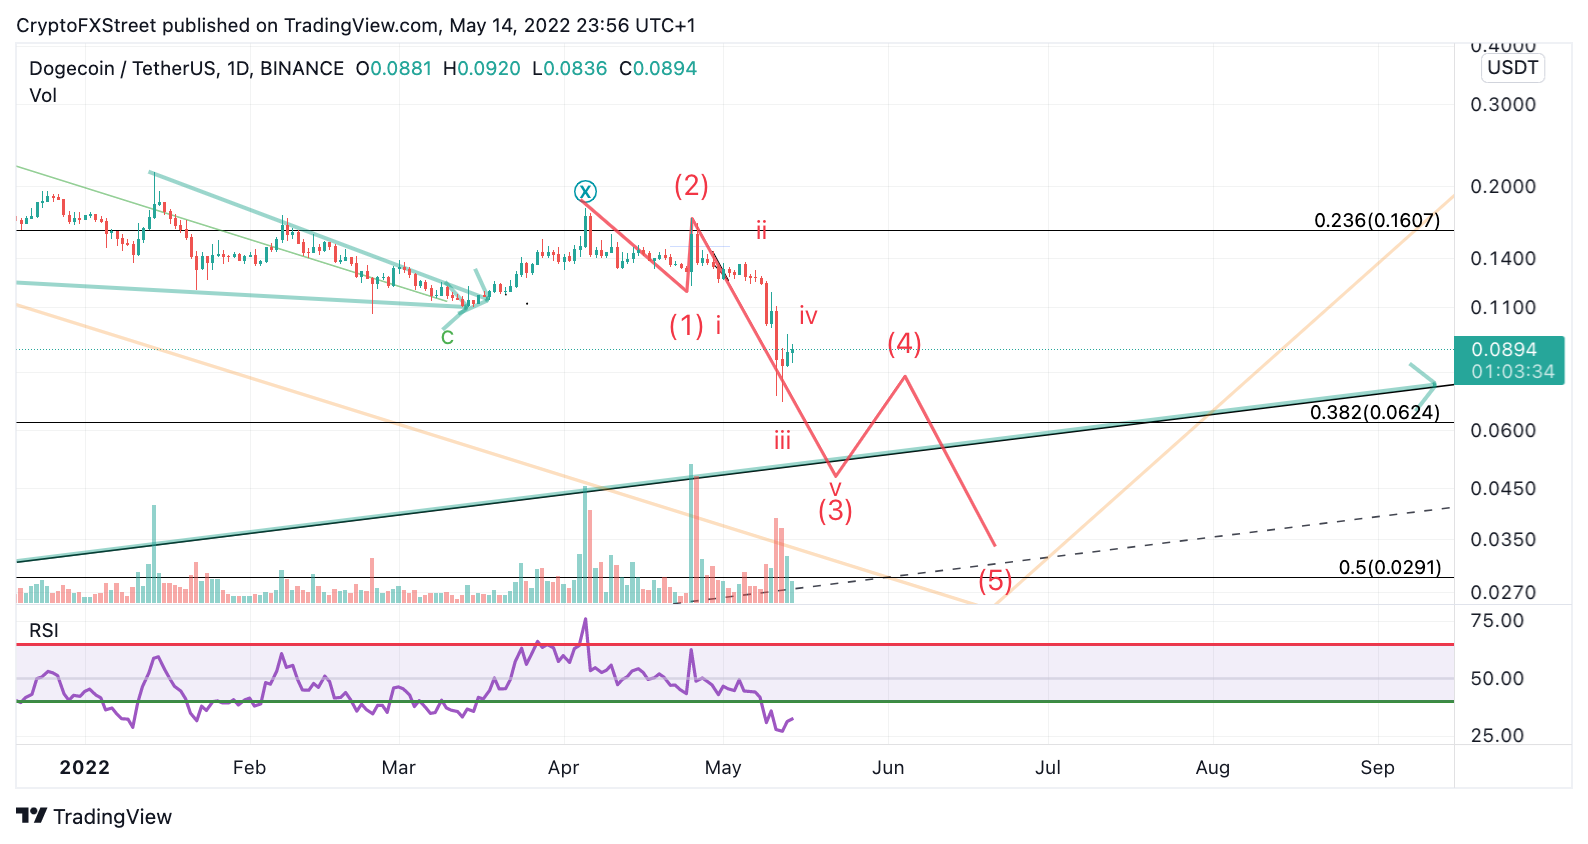
Dogecoin price could decline in free-fall action as the technicals indicate an unfolding wave three within the bearish downtrend. The bears managed to print a large bearish engulfing pattern on May 11th, which is now the largest candle within the entire downtrend. Traders reading the bullish hammer on the 12th as a bullish entry signal should consider zooming out and re-evaluating the macro trend.

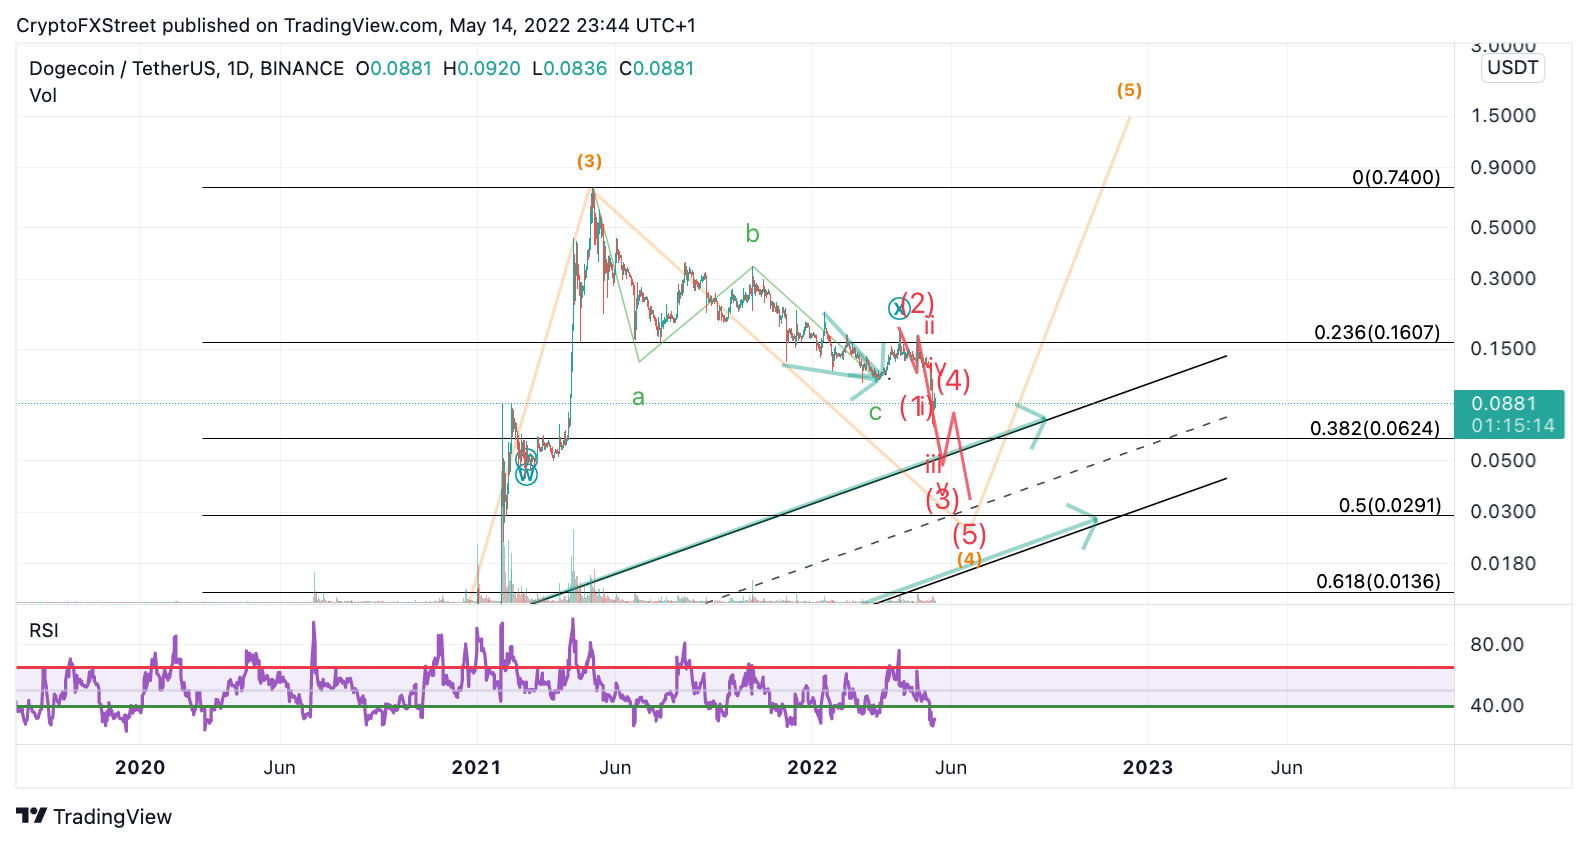
Dogecoin price shows a classic ramping pattern in bearish favor on the volume indicator. The lack of volume coming in after the hammer on the 12th also hints that the current uptrend is more than likely a corrective structure to connect the next declining impulse. If this Elliot Wave thesis is correct, the bears could finally breach the historical trend channel, which analysts have warned of for several months. The strength of the current bearish impulse could send prices to $0.02 in the coming weeks.
TM/DOGE/5.14.22

DOGE/USDT 1-Day Chart

Invalidation of the current downtrend is a breach at $0.115. If the bulls can breach this level, then the DOGE price could rally back to $0.14 and $0.16, resulting in up to a 100% increase from the current Dogecoin price
Tm/DOGE5/14/22

DOGE/USDT 1-Day Chart

Author

Tony M.

Tony M.

FXStreet Contributor

Tony Montpeirous began investing in cryptocurrencies in 2017. His trading style incorporates Elliot Wave, Auction Market Theory, Fibonacci and price action as the cornerstone of his technical analysis.


More from Tony M.
Share:

Editor's Picks

Top 3 Price Predictions: BTC, ETH and XRP rebound as major support levels cap recent sell-off

Bitcoin, Ethereum and Ripple rebound modestly on Friday after correcting and testing their key support zone the previous day. BTC holds the 50-day Exponential Moving Average, ETH finds support around the 100-day EMA, while XRP holds the horizontal floor near $1.300.

Why Hyperliquid is losing RWA market share to centralized exchanges

Hyperliquid (HYPE) is losing market share in real-world asset perpetual futures to centralized exchanges even as the overall financial market faces pressure. Hyperliquid’s trade.xyz accounted for roughly 80% of RWA perpetual trading volume in July, according to Artemis data shared by Ark Invest Digital Asset Head of Research Lorenzo Valente..

Cardano Price Forecast: Whale selling deepens ADA correction

Cardanoedges higher by nearly 2% on Friday, following a roughly 6% decline the previous day. The pullback aligns with the sell-side appeal among large-wallet investors, commonly referred to as whales, and Cardano derivatives. The technical outlook for ADA is bearish, with downside momentum persisting. Whales are losing their appetite for holding ADA tokens, fueling near-term selling pressure.

Bitcoin falls 4% as chip stocks plunge 6.7% and oil surges
Bitcoin (BTC) fell below $82,000 on Thursday as the crypto market joined a broader market sell-off driven by concerns over artificial intelligence (AI) spending, rising oil prices and escalating geopolitical tensions involving the US and Iran. The top crypto fell 4% to $81,130 as macro fears weighed on prices across the digital asset market.
Bitcoin: Macroeconomic headwinds, cooling demand cap BTC gains
Bitcoin (BTC) extends losses this week, trading below $82,500 as of Friday as selling pressure continues. Weakening institutional demand supports this pullback as BTC spot Exchange-Traded Funds (ETFs) are on track to record a two-week withdrawal streak, reaching $146.19 million in net outflows through Thursday.