Decentraland to move below $3 despite MANA recovery from flash-crash
- Decentraland price outperformed the broader crypto market during the Saturday flash-crash.
- Extreme overbought conditions remain, and a true correction remains likely.
- Extreme bearish divergences on the weekly chart point to a deep dive lower.

Decentraland price action, before the flash-crash, showed signs that it was slowing down and momentum was waning. However, because the flash-crash was due to NOS (Non-Organic Selling), the outlook for Decentraland has not changed.
Decentraland price to correct by 30%, flash-crash recovery not important
Decentraland price and the broader metaverse and gaming token sectors remain highly overbought. Parabolic is the name for it. A false sense of relief was probably felt by bulls after a spectacular recovery and positive daily close on Saturday was accomplished. However, that feeling may not last.
NOS (Non-Organic Selling) is a technical term to describe any price action that is done mainly due to resting buy and sell orders or, as is often the case in the cryptocurrency market, forced liquidations from leveraged positions in derivatives markets. The flash-crash on Saturday is a perfect example of what NOS looks like and what the expected recovery should look like.
There remains a massive discrepancy on the weekly Decentraland price candlestick chart and its oscillators. The Composite Index and the candlestick chart show no significant divergences over the long term. But between the Relative Strength Index (RSI) and the Composite Index, a massive and drawn-out divergence does exist. That divergence is known as regular bearish divergence.
Regular bearish divergence occurs when higher highs are made on the candlestick chart, but lower highs are made in the RSI. Regular bearish divergence is a warning that the current trend may face an imminent correction or broad trend change.
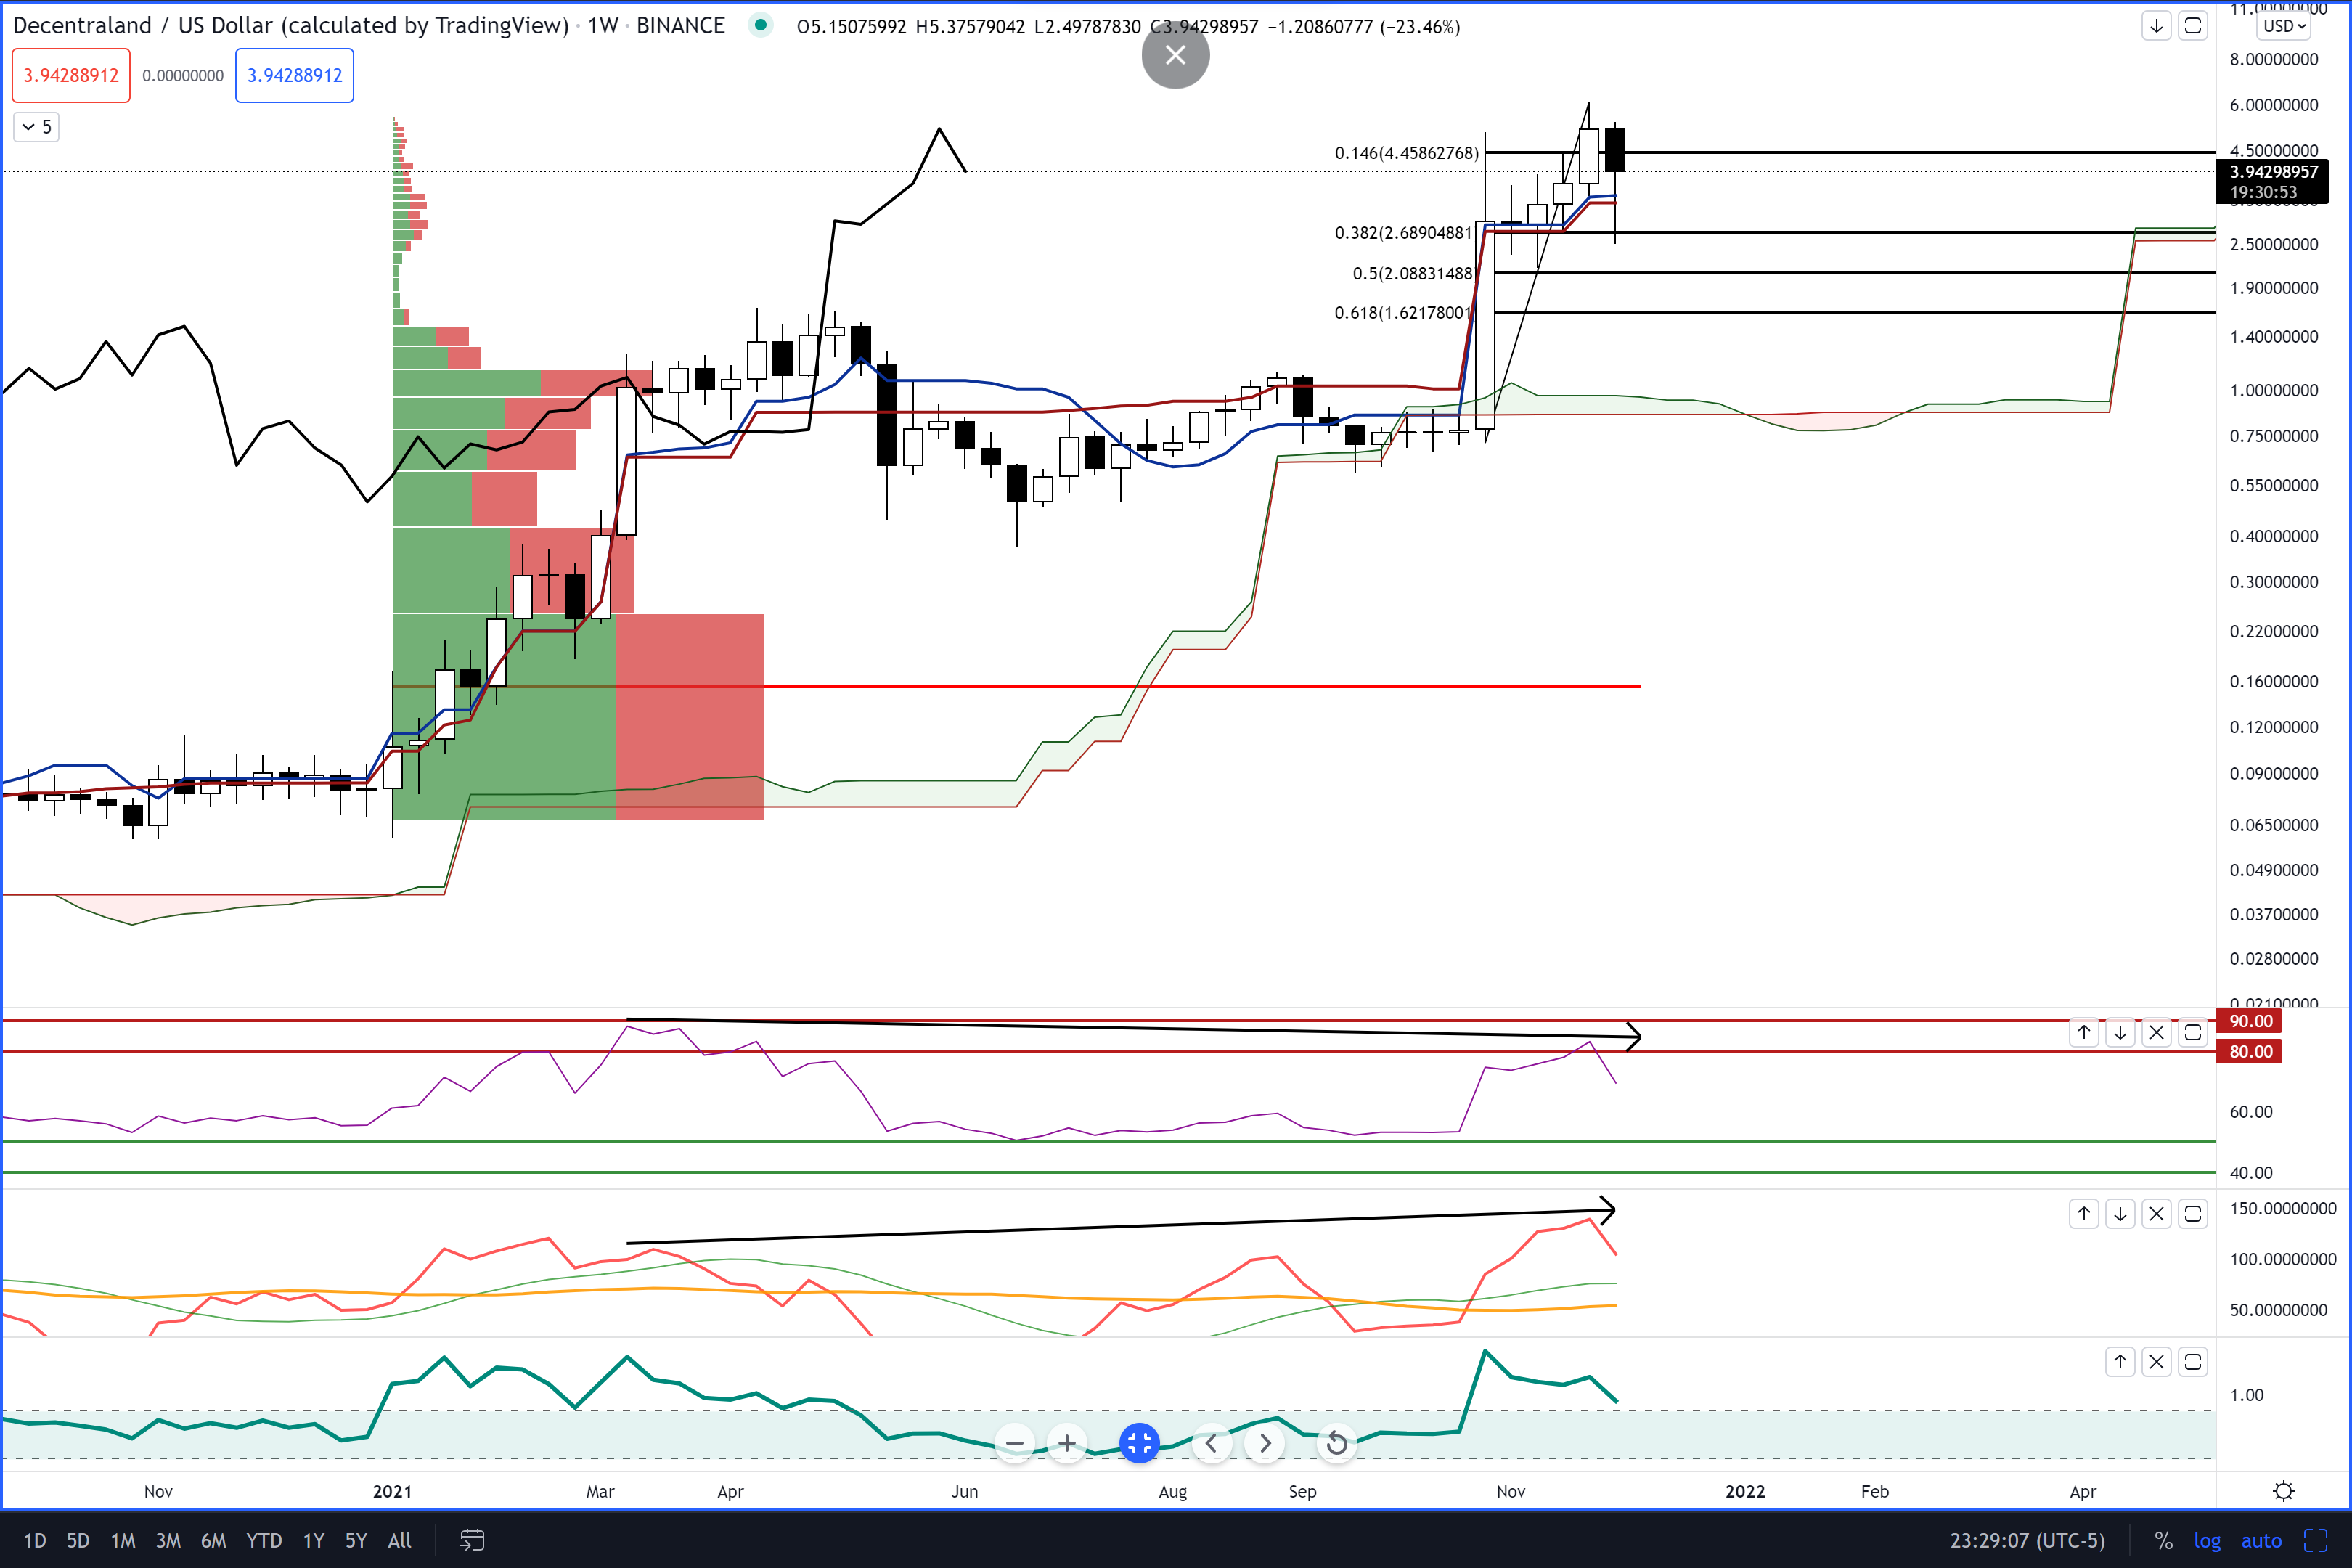
MANA/USDT Weekly Ichimoku Chart
The likelihood of this occurring is strong because of the extreme overbought conditions in the RSI. Additionally, the slope of the RSI, Composite Index, and %B have a slope that exceeds 45-degrees, generating a bearish ‘hook’ pattern. The projected zone for major support is near the $3.00 value area.
This near-term bearish outlook is invalidated if Decentraland price makes a new all-time high weekly close.
Author

Jonathan Morgan
Independent Analyst
Jonathan has been working as an Independent future, forex, and cryptocurrency trader and analyst for 8 years. He also has been writing for the past 5 years.


