Decentraland price wipes out retail traders, here's what could happen next
- MANA price fell by 30% in the last 24 hours.
- The volume profile indicator shows an influx of bearish pressure.
- Invalidation of the bearish thesis is a breach above $0.64.

Decentraland price witnessed a bearish storm during the midterm elections. As the price hovers below $0.60, traders are forced to question will the downtrend continue. Or have the bulls already capitulated?
Decentraland price nosedives
Decentraland price experienced a 30% mudslide on November 8 during the midterm elections. MANA, the Ethereum-based virtual world token, fell penny-from-Eiffel style during the New York session after the bulls completely abandoned ship near the psychological $0.60 level. The new Volume Profile Index evidence suggests that MANA may mudslide toward $0.50 and beyond.
Decentraland price currently auctions at $0.56 as the bulls have produced several large bearish engulfing candles on the 1-hour chart. The move south was catalyzed after the bulls failed to provide support at both the 8-day exponential and 21-day simple moving averages. The Relative Strength Index shows the current decline as reaching extremely oversold levels, suggesting the bears still have the strength to lower the MANA price further.
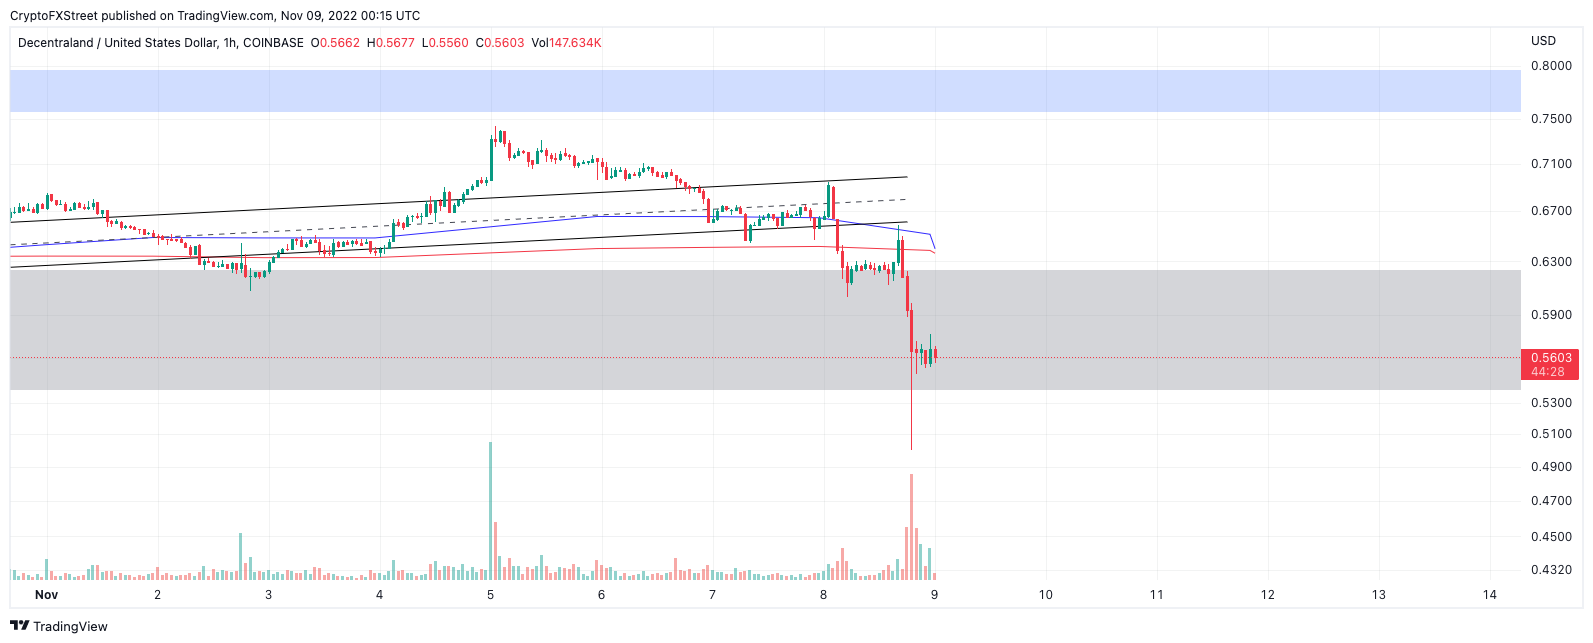
MANAUSDT 1-Hour Chart
Combining these factors, there is still potential for MANA to head lower. If market conditions persist, a breach of the $0.50 level stands a fair chance of occurring. If the $0.50 does not hold as support, MANA could land in 2020 congestion zone near $0.44. This would be an additional 35% decline from the current MANA price.
Invalidation on the bearish thesis could occur if the bulls hurdle the $0.60 thrust candle. If the bulls tag the level, a further rise toward the previous congestion zone at $66 could occur. Such a move would result in an 18% increase from the current market value.
In the following video, our analysts deep dive into the price action of Bitcoin, analyzing key levels of interest in the market. -FXStreet Team
Author

Tony M.
FXStreet Contributor
Tony Montpeirous began investing in cryptocurrencies in 2017. His trading style incorporates Elliot Wave, Auction Market Theory, Fibonacci and price action as the cornerstone of his technical analysis.


