|

Decentraland continues downtrend as MANA faces a 30% drop

  • Decentraland price continues its slide south.
  • Final support structure to dictate the trend for the remainder of 2021.
  • Severe fall is likely if key support zones fail to hold.

Decentraland price has struggled over the past two weeks to generate any momentum above the daily Tenkan-Sen. Little response by buyers has allowed the bears to continue with persistent selling pressure.

Decentraland price tests final support range between $2.75 and $3.25

Decentraland price action, like many cryptocurrencies, is up against one of its last support structures before facing a steep drop. The red shaded zone on the chart below represents the final support level before a massive capitulation move would occur.

$2.80 is the critical level to watch for this week. MANA looks poised to push down to $2.80 to test buyers and hodlers resolve. Traders should expect strong support as it is a high volume node, Senkou Span B, and the 38.2% Fibonacci retracement share that value area. However, failure to hold that zone could spell disaster.
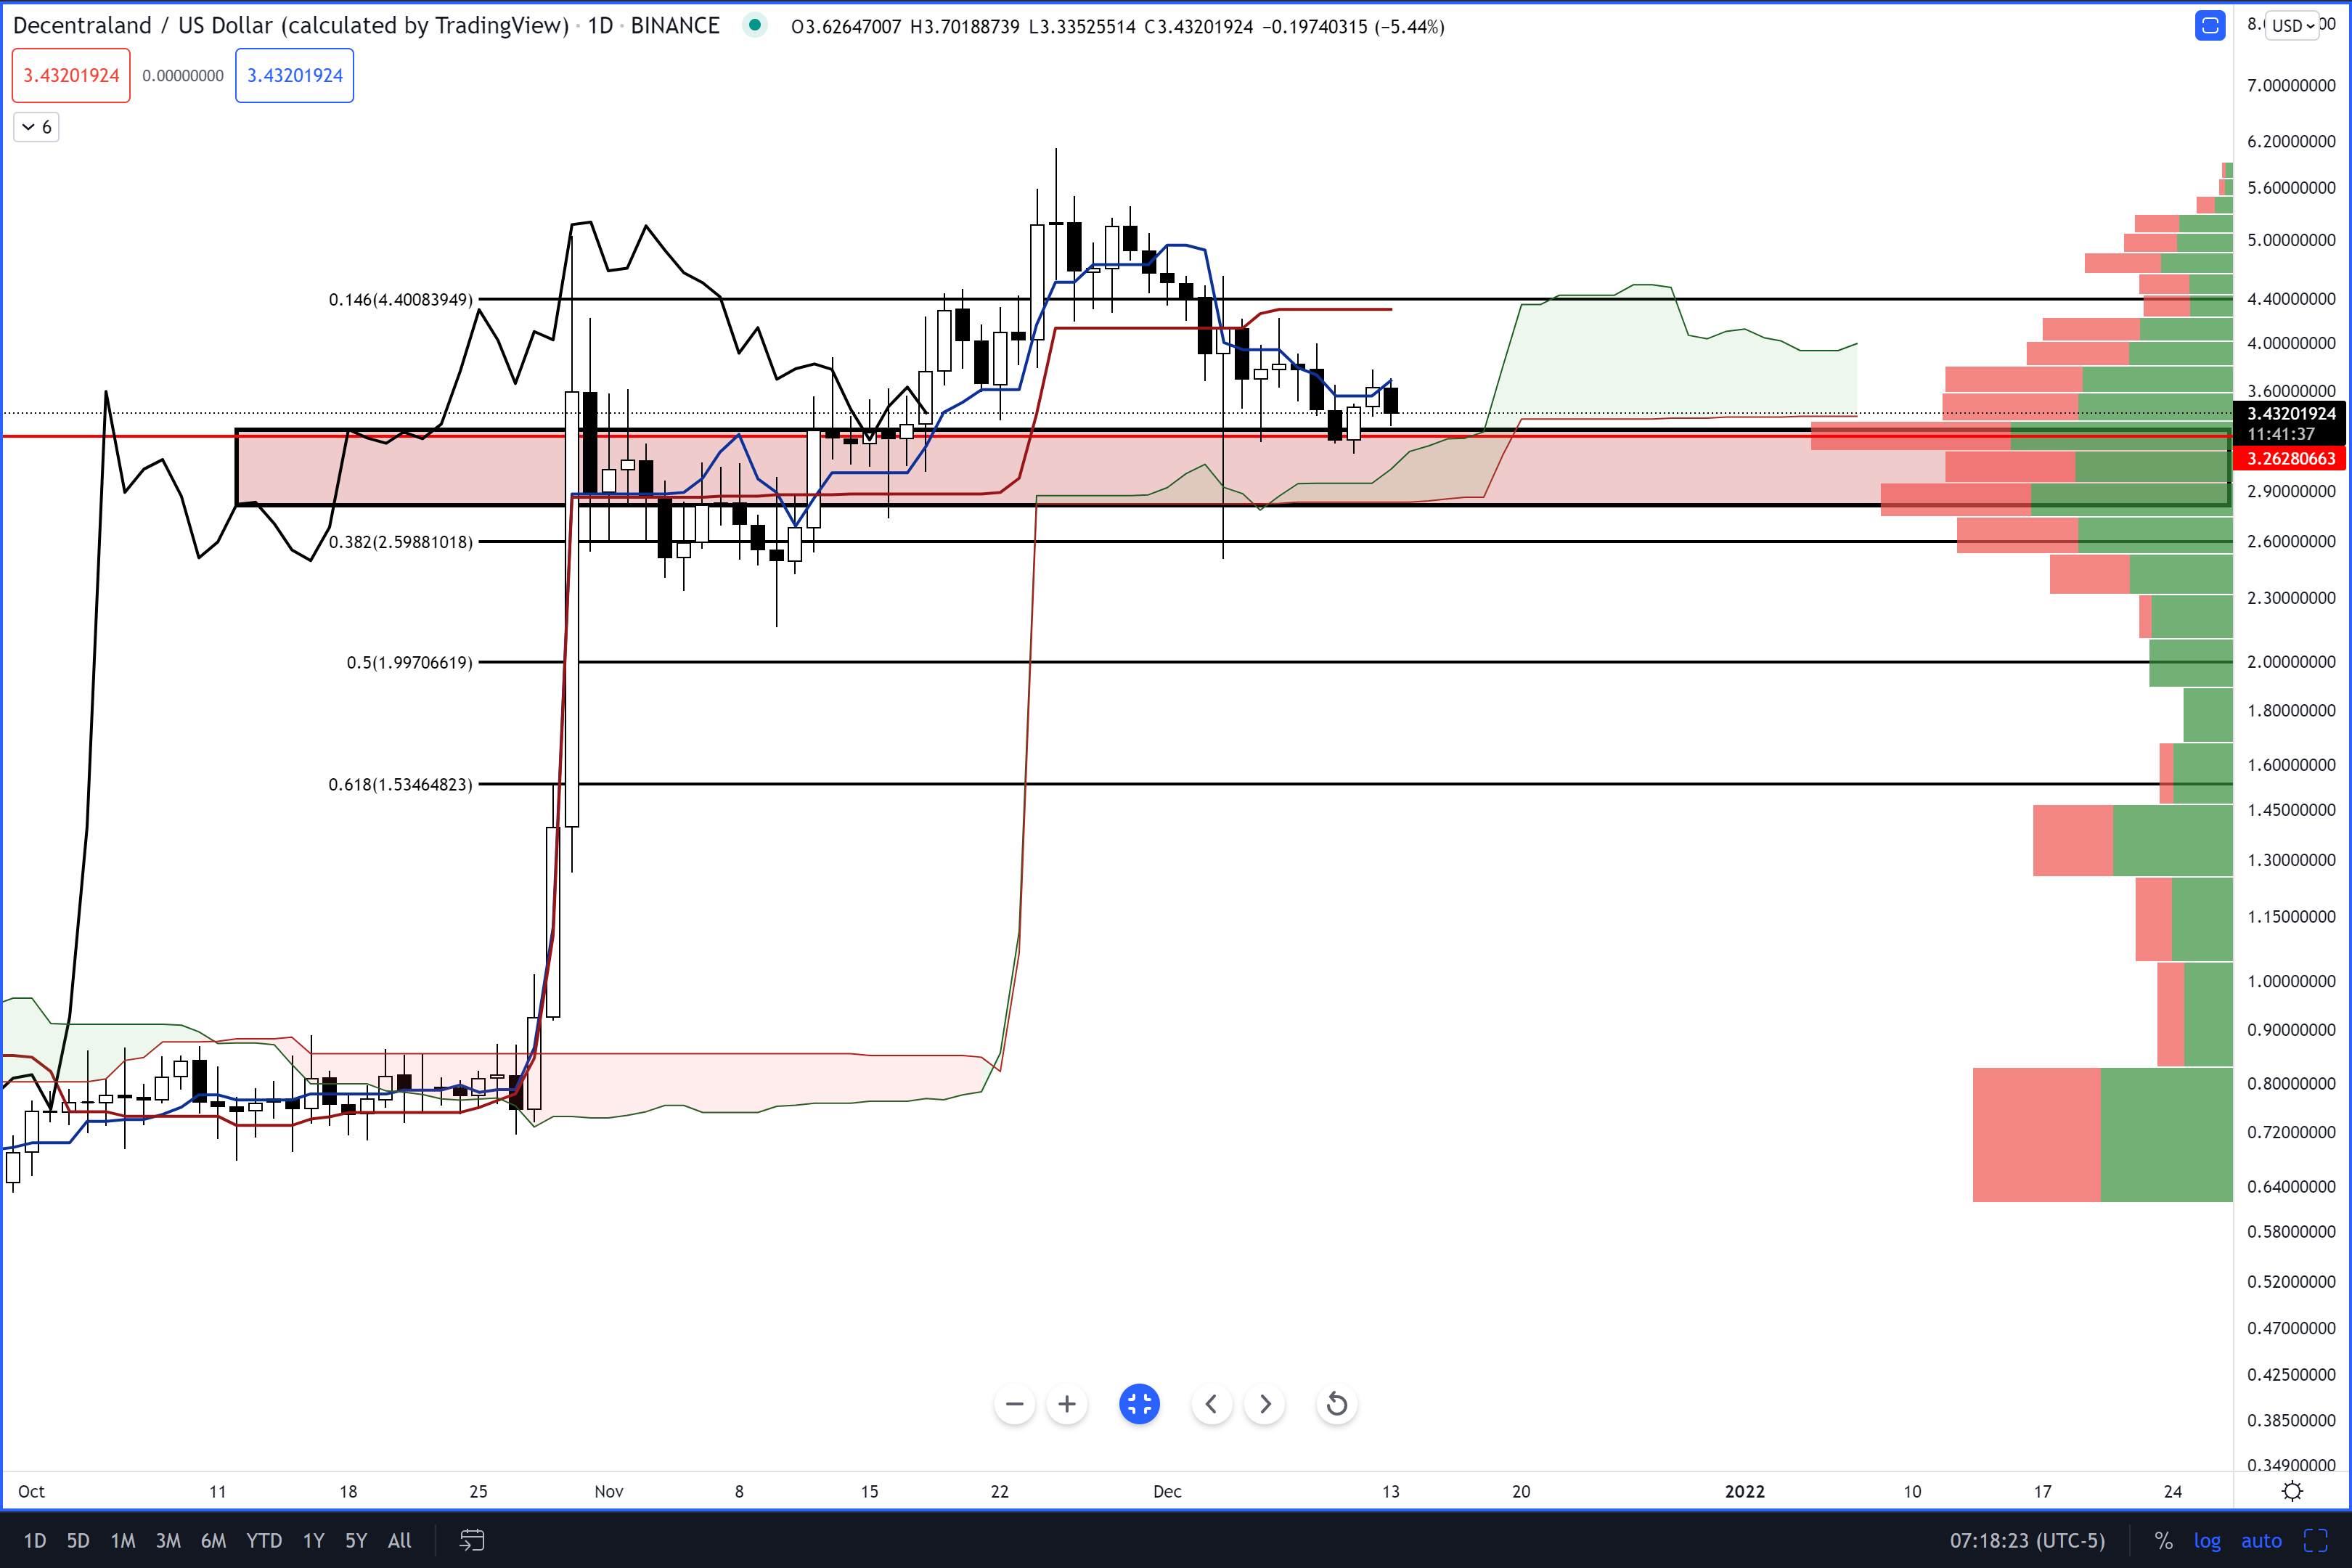
MANA/USDT Daily Ichimoku Chart

A daily close at or below $2.80 would trigger two significantly bearish events. The first would be a break below the final high volume node between $2.80 and $1.00. The second bearish event is Decentraland price fulfilling all the requirements for an Ideal Bearish Ichimoku Breakout – a signal that sustained pressure south is likely to remain.

In order to invalidate any near-term bearish outlook, Decentraland price needs a significant rally. MANA would need to first close above the Tenkan-Sen at $3.70, but ultimately it needs to close above the daily Kijun-Sen at $4.55.

Author

Jonathan Morgan

Jonathan Morgan

Independent Analyst

Jonathan has been working as an Independent future, forex, and cryptocurrency trader and analyst for 8 years. He also has been writing for the past 5 years.


More from Jonathan Morgan
Share:

Editor's Picks

Bitcoin Weekly Forecast: BTC retreats as macro headwinds grow
Bitcoin (BTC) remains under pressure, down over 4% this week and trading around $76,900 at the time of writing on Friday. Institutional demand shows signs of weakness as spot BTC Exchange Traded Funds (ETFs) are on track to end their three-week inflow streak, recording nearly $500 million in net outflows through Thursday.
XRP falls toward key support as macro uncertainty, weak momentum cap recovery
Ripple (XRP) falls below $1.33 on Friday, marking the third consecutive day of declines. The token continues to track the broader cryptocurrency market downturn, with investors closely monitoring heightened macroeconomic uncertainty ahead of the United States (US) Consumer Price Index (CPI) release and next week’s Federal Reserve (Fed) monetary policy decision.
Crypto Today: Bitcoin, Ethereum, XRP stabilize at lower levels amid ETF outflows and macroeconomic risks
The broader cryptocurrency market is rising on Friday, with Bitcoin (BTC) trading above $77,000 after testing lower support near $76,500. Ethereum (ETH) shows signs of stability, hovering above the support provided at $2,400 despite capped upside at $2,500. Meanwhile, Ripple (XRP) holds above $1.33 after three straight days of declines, reflecting growing headwinds due to macroeconomic uncertainty.
Bitcoin pulls back as another golden cross fails to deliver
Earlier this week, Bitcoin formed a golden cross, a technical signal that occurs when the price’s 50-day moving average rises above the 200-day moving average and is conventionally viewed as a precursor to a bullish rally. Historically, however, that’s often not been the case.
Bitcoin: BTC retreats as macro headwinds grow
Bitcoin (BTC) remains under pressure, down over 4% this week and trading around $76,900 at the time of writing on Friday. Institutional demand shows signs of weakness as spot BTC Exchange Traded Funds (ETFs) are on track to end their three-week inflow streak, recording nearly $500 million in net outflows through Thursday.


