Decentraland Price Prediction: MANA ready to rally toward the round level of $5
- Decentraland price is gearing up for a 36% ascent as the bulls prepare to tackle a stiff hurdle nearby.
- MANA is eyeing a target of $5 next as the bulls gather strength.
- Major support is holding steady at $3.14 if selling pressure rises.

Decentraland price has been consolidating after its massive run toward its all-time high at $5.89 on November 25. MANA appears to be ready to escape its recent downtrend as it nears a critical hurdle. Slicing above the crucial line of resistance could unleash 36% gains for the token.
Decentraland price eyes 36% climb
Decentraland price has printed a symmetrical triangle pattern on the 4-hour chart, appearing to have shown investors few visible clues as to directional intentions. However, MANA is now approaching the upper boundary of the governing technical pattern, indicating that the bulls are about to be finished with catching their breath amid the uptrend.
The first resistance Decentraland price may face is at the 50 four-hour Simple Moving Average (SMA) at $3.63, coinciding with the topside trend line of the prevailing chart pattern. Breaking above this level could put the bullish target of a 36% ascent on the radar, toward $5.00.
Another hurdle may emerge at the 50% retracement level at $3.85, intersecting with the resistance line given by the Momentum Reversal Indicator (MRI) and the 200 four-hour SMA. An additional obstacle may appear at the 61.8% Fibonacci retracement level at $4.17, which sits near the 100 four-hour SMA, then at the 78.6% Fibonacci retracement level at $4.63.
The December 2 high may also act as a headwind for Decentraland price at $4.81 before the bulls aim for the aforementioned optimistic target at $5.00.
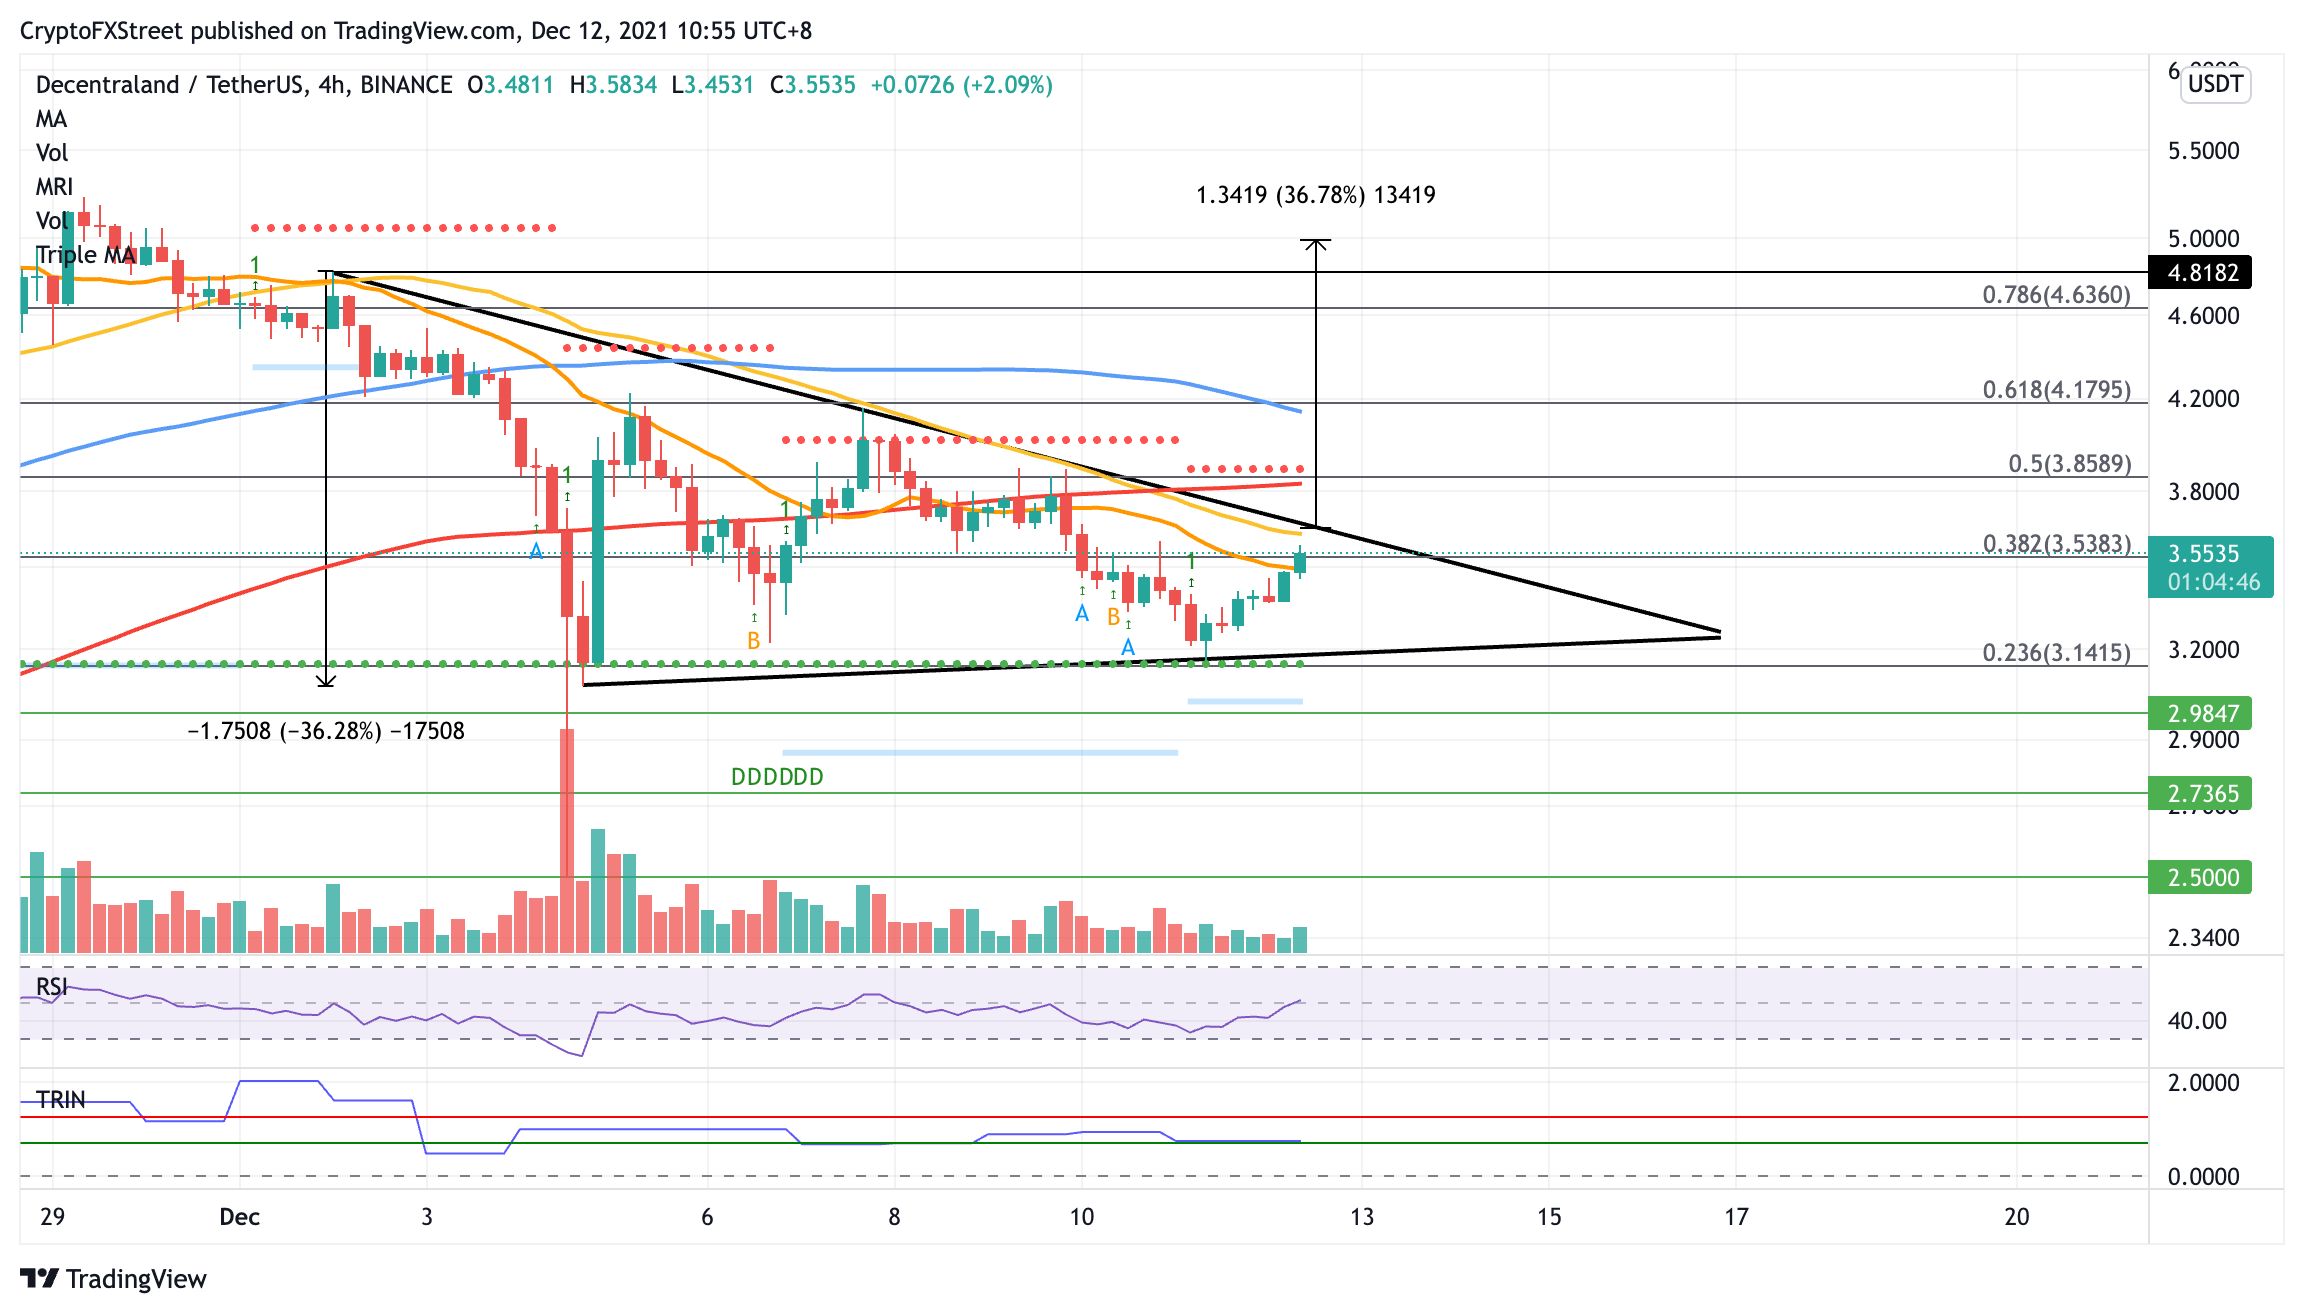
MANA/USDT 4-hour chart
If the bullish outlook falters, Decentraland price will discover immediate support at the 38.2% Fibonacci retracement level at $3.53, then at the 21 four-hour SMA at $3.49. If selling pressure increases, MANA could slide further to find a line of defense at the lower boundary of the triangle at $3.19.
Investors should note that falling below the aforementioned foothold may spell trouble for the bulls, as a 36% drop may be on the radar for Decentraland price. However, an additional line of defense will appear at the 23.6% Fibonacci retracement level at $3.14, which intersects with the MRI’s support line.
If a catastrophic sell-off occurs, Decentraland price may slide further toward the November 7 high at $2.98.
Author

Sarah Tran
Independent Analyst
Sarah has closely followed the growth of blockchain technology and its adoption since 2016.




