Dash Price Forecast: DASH defies headwinds, paces toward $100
- Dash extends its rally, reaching an intraday high of $96.85 despite the broader crypto market correcting.
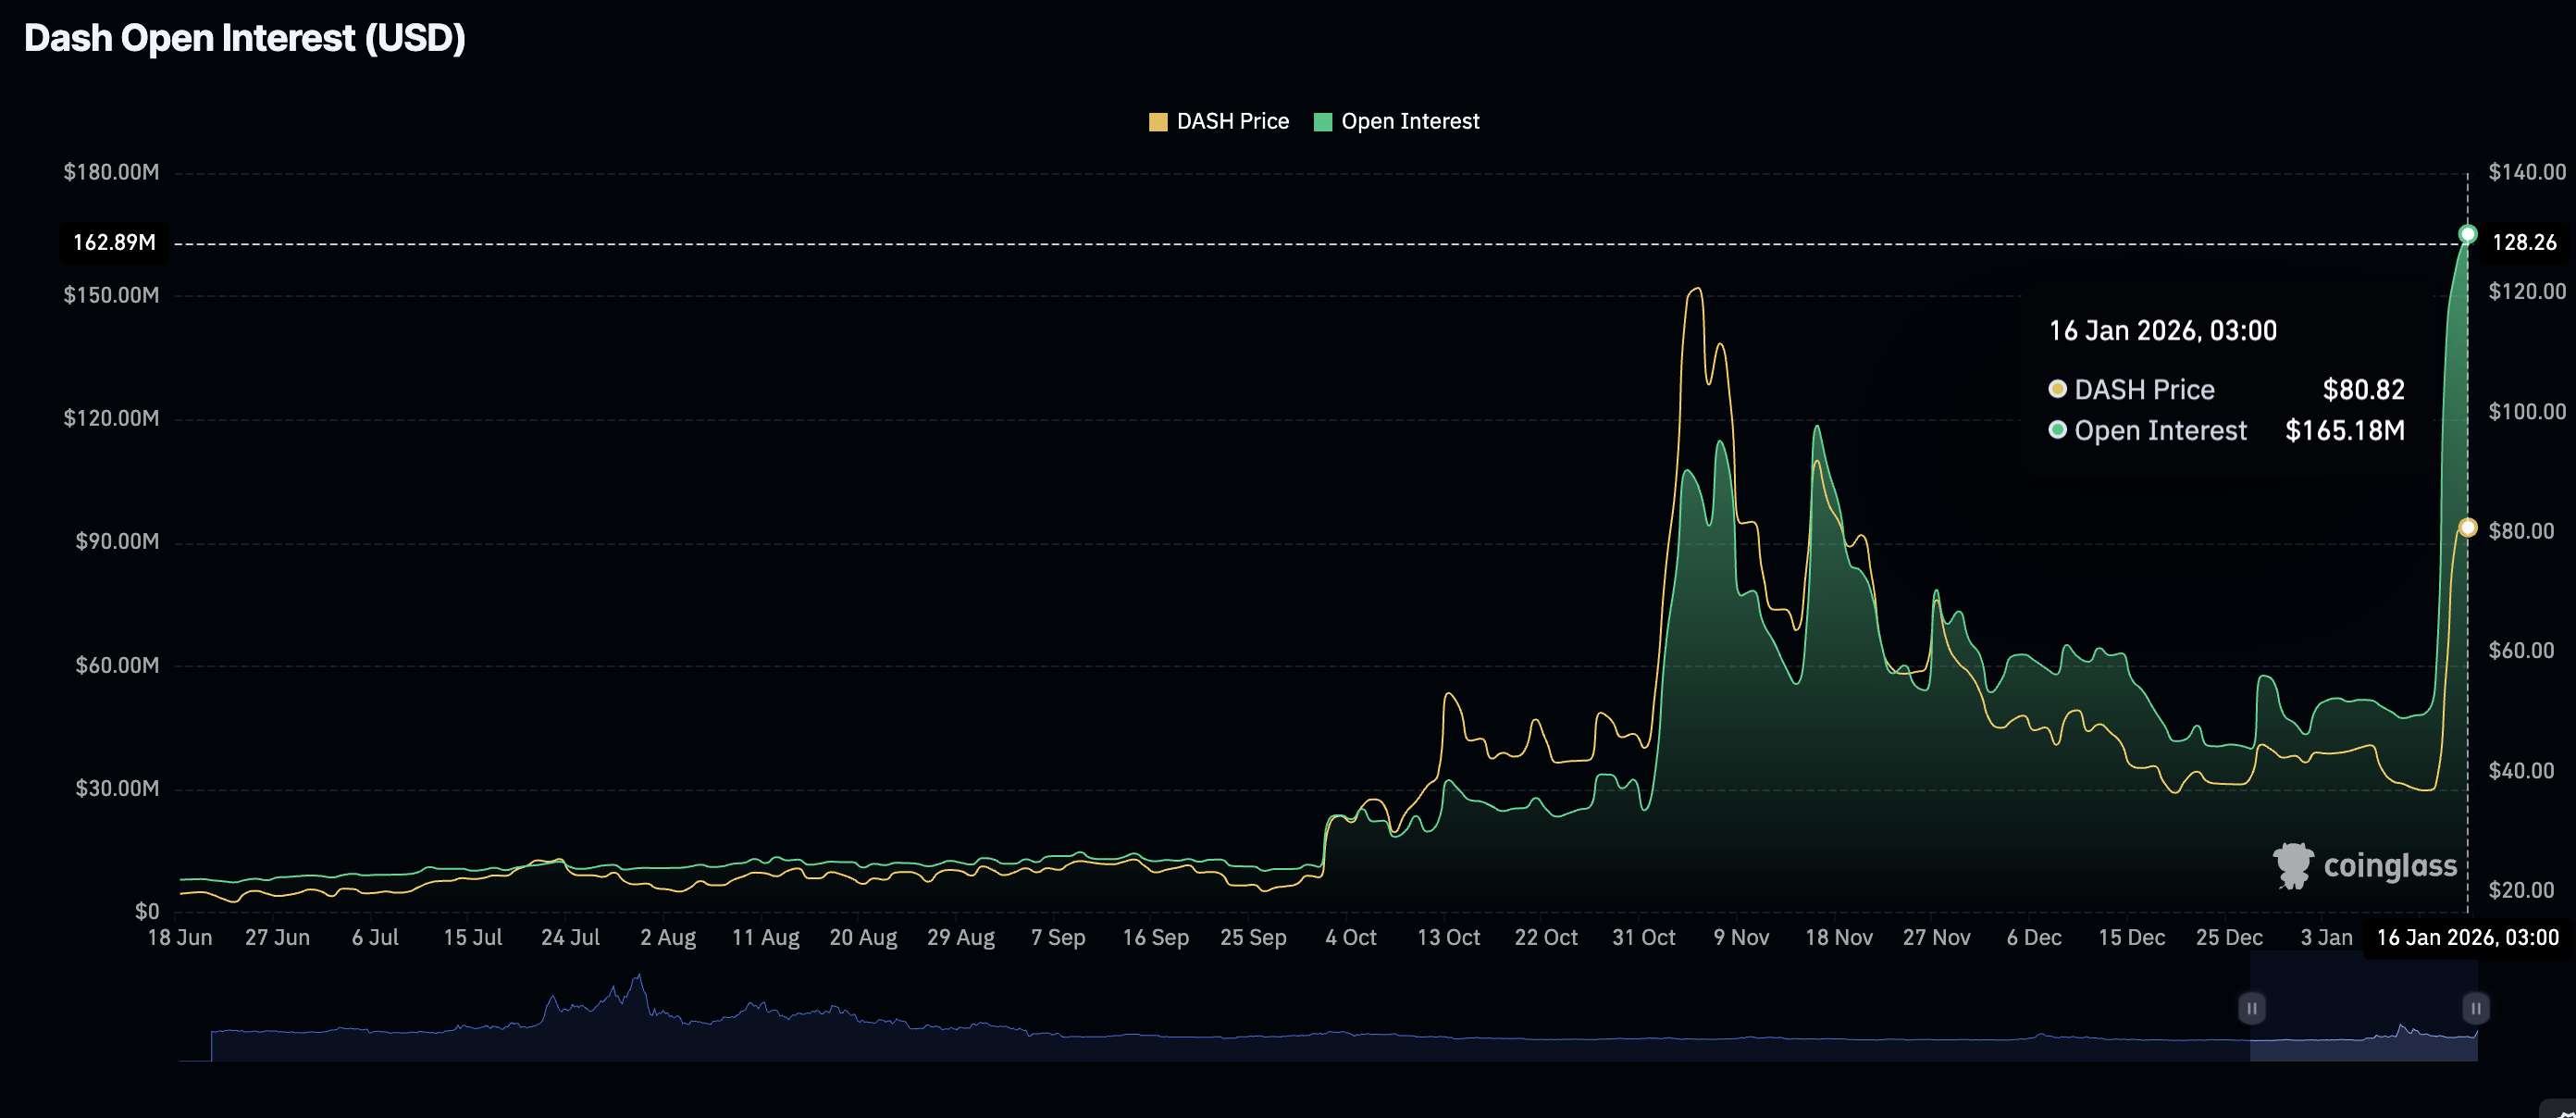
- Retail interest in DASH explodes as futures Open Interest soars to $165 million.
- The MACD indicator supports DASH’s short-term bullish outlook, but an overbought RSI signals a correction could be in the offing.

Dash (DASH) is showing strength, trading at $88.47 at the time of writing on Friday, as interest in the privacy-focused token surges with a six-day rising strike. Although the price has corrected from an intraday high of $96.85, DASH is still up over 7%. A strong technical structure supports Dash’s short-term bullish outlook.
Retail demand ignites Dash rally
The Dash derivatives market has experienced massive growth since the week started, with futures Open Interest (OI) reaching $165 million on Friday from $158 million the previous day. CoinGlass data shows that OI averaged $48 million on Monday.
OI is a metric that represents the total notional value of outstanding futures contracts. Consequently, consistent increases in OI often indicate growing investor interest and market participation in the token.
Technical outlook: Dash bulls tighten their grip
The token has sustained its uptrend for six consecutive days, reflecting the increased retail demand mentioned above and support from strong technical levels.
The Moving Average Convergence Divergence (MACD) indicator has also maintained a buy signal triggered on January 13. The MACD remains above the signal line and, along with the histogram expanding above the mean line, reinforces DASH’s short-term technical outlook.
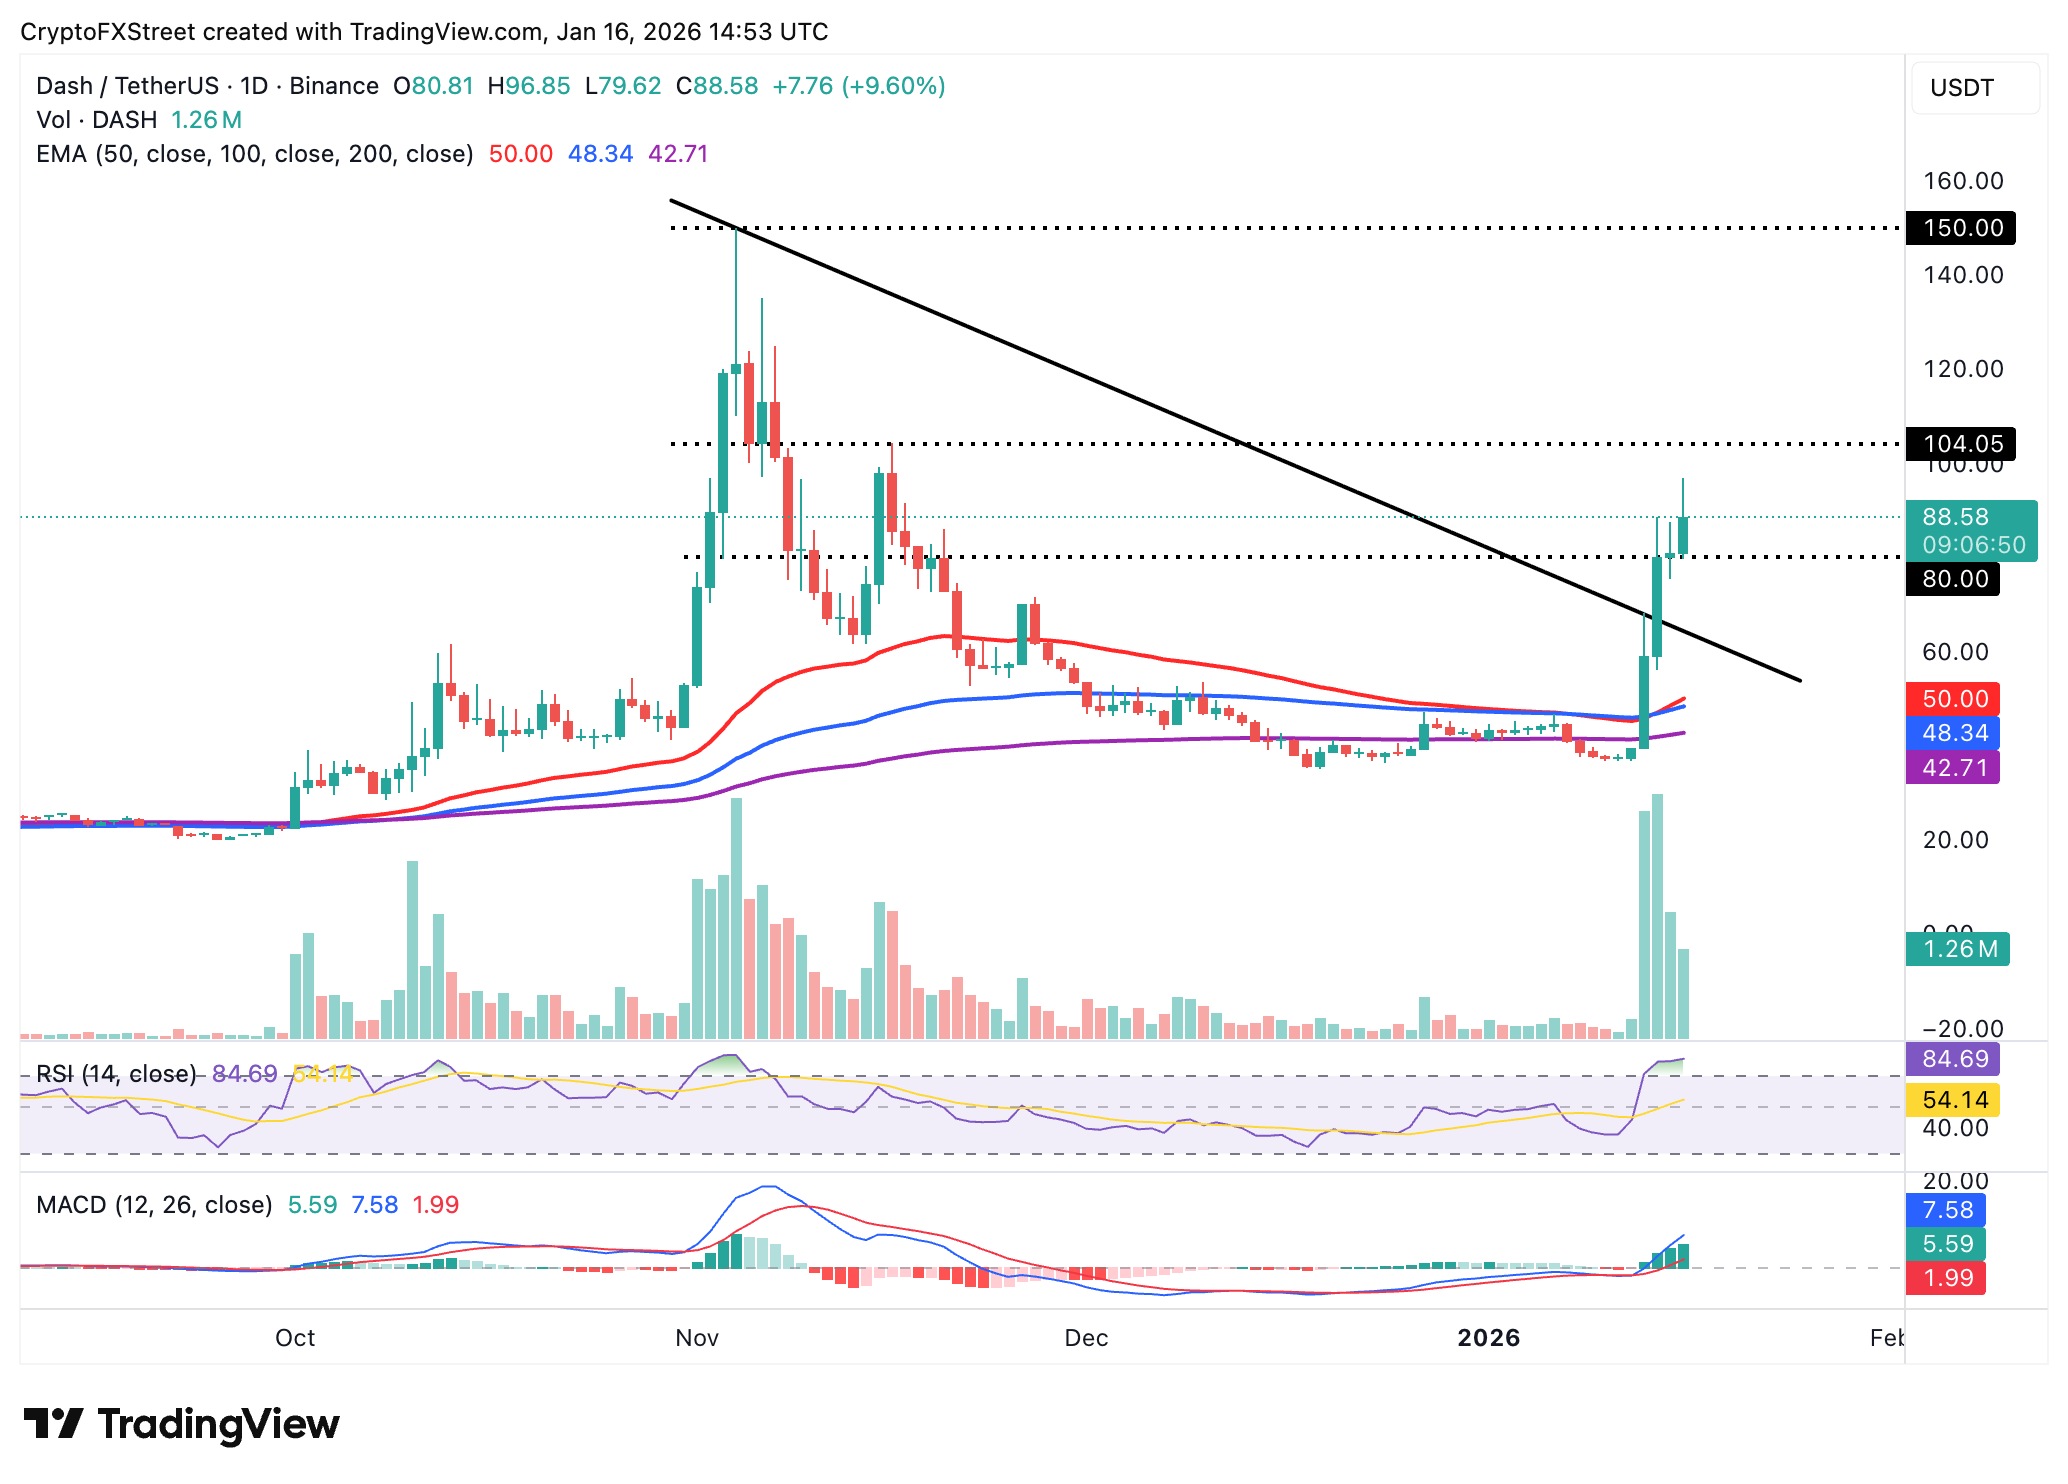
Closing above the immediate hurdle at $90.00 would keep the bulls on track and ease pressure from the short-term support at $80.00.
The Relative Strength Index (RSI) is at 85 on the daily chart, highlighting Dash’s overbought conditions. If the RSI moves higher, bullish momentum will increase, prompting the price to push above the psychological $100.00 level. However, an overbought RSI indicates that the asset may be overextended and vulnerable to a near-term correction.
Open Interest, funding rate FAQs
Higher Open Interest is associated with higher liquidity and new capital inflow to the market. This is considered the equivalent of increase in efficiency and the ongoing trend continues. When Open Interest decreases, it is considered a sign of liquidation in the market, investors are leaving and the overall demand for an asset is on a decline, fueling a bearish sentiment among investors.
Funding fees bridge the difference between spot prices and prices of futures contracts of an asset by increasing liquidation risks faced by traders. A consistently high and positive funding rate implies there is a bullish sentiment among market participants and there is an expectation of a price hike. A consistently negative funding rate for an asset implies a bearish sentiment, indicating that traders expect the cryptocurrency’s price to fall and a bearish trend reversal is likely to occur.
Author

John Isige
FXStreet
John Isige is a seasoned cryptocurrency journalist and markets analyst committed to delivering high-quality, actionable insights tailored to traders, investors, and crypto enthusiasts. He enjoys deep dives into emerging Web3 tren