Crypto.com Price Prediction: CRO can plummet down to $0.057 after extended weakness
- CRO is currently trading at $0.106 after dropping more than 30% within the past week.
- We have discussed the possibility of CRO facing a multiple-month correction in an older article.

CRO is trading at $0.106 after establishing a strong daily downtrend that doesn’t seem to stop. Bears are in total control over practically all time-frames as bulls continue trying to see any kind of rebound. Unfortunately, there aren’t many support levels on the way down for CRO.
Can CRO recover from this massive downtrend?
In our last article about CRO, we discussed the possibility of the asset facing a multiple-month correction period despite previous gains. At the time, the native token of Crypto.com was trading at around $0.16 after a massive bull rally, however, several indicators turned bearish for the digital asset.
CRO/USD daily chart
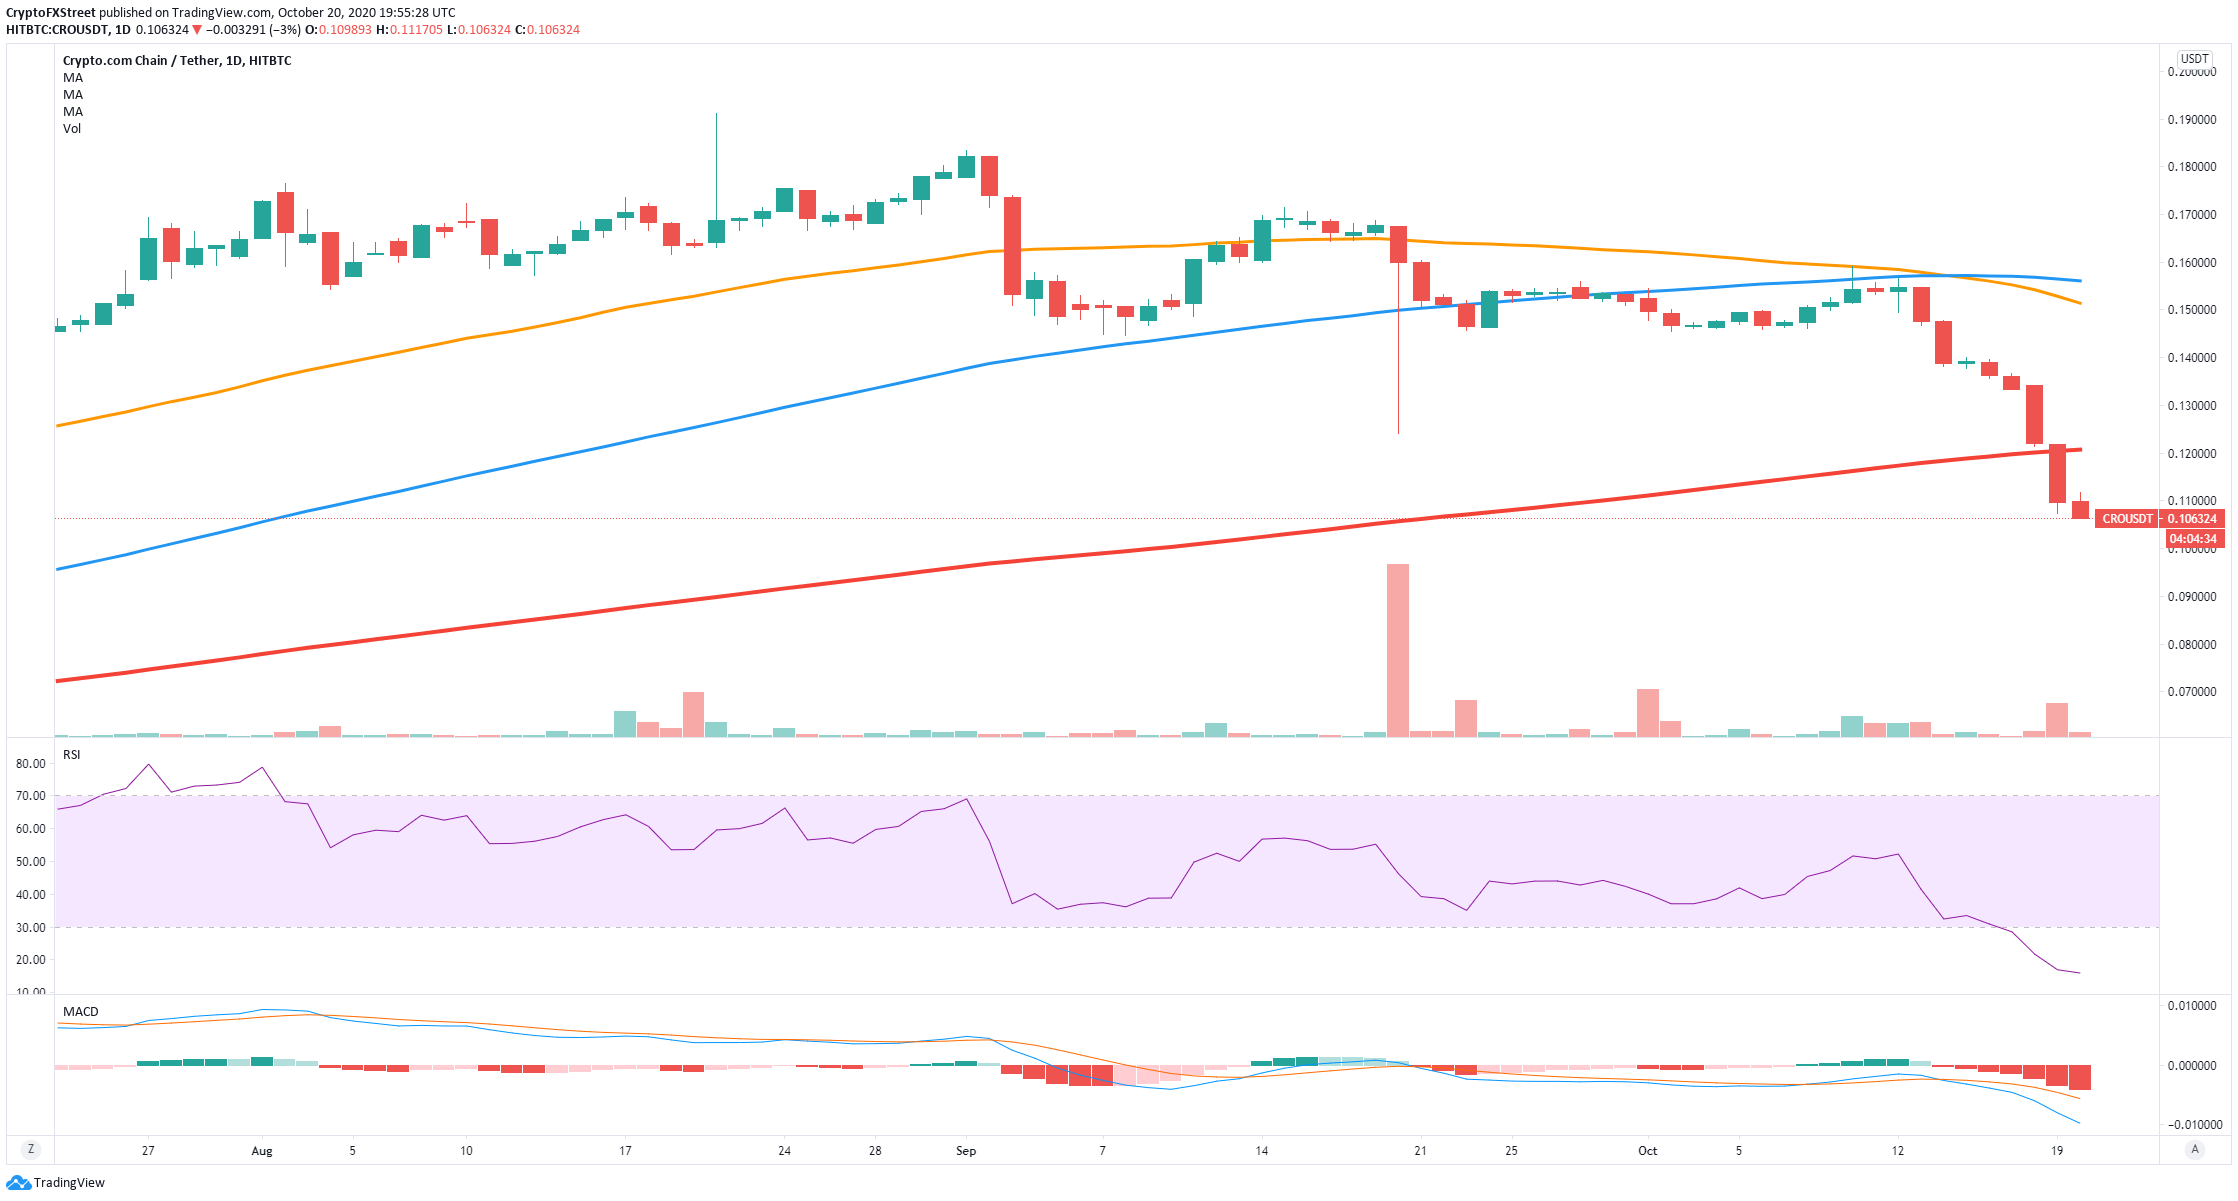
We accurately predicted the top of CRO which is now in a robust daily downtrend after establishing several lower highs and a massive lower low in the past 24 hours. The digital asset also lost all three SMAs which are transformed into resistance levels.
CRO IOMAP Chart
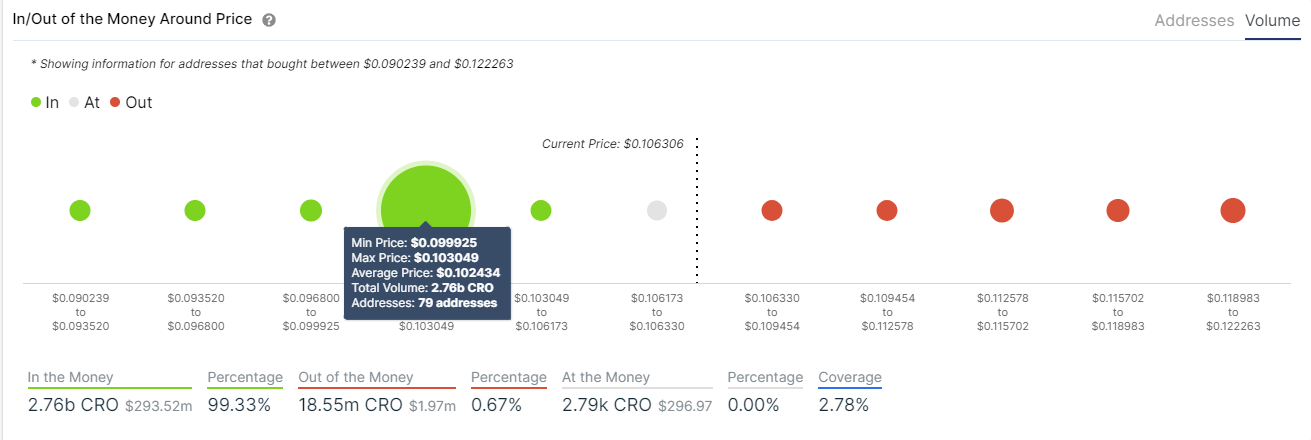
The MACD turned bearish on October 14 and it’s gaining a lot of strength quickly. The In/Out of the Money Around Price chart shows only one notable support area between $0.099 and $0.103 where 2.76 billion coins were bought. A breakout below this point can easily drive the price of CRO down to $0.057.
On the other hand, the IOMAP chart also shows that CRO bulls aren’t facing a lot of resistance to the upside when compared to the support area mentioned above. On top of that, the number of new addresses and active addresses has grown significantly over the past week.
CRO New And Active Addresses Chart
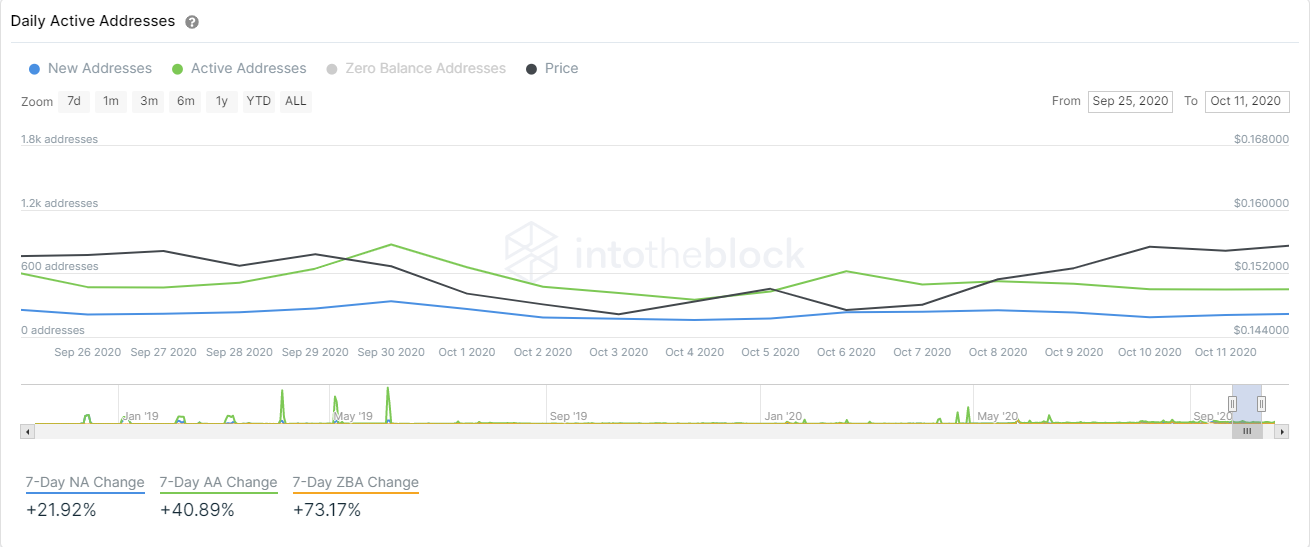
The number of new addresses joining the network grew by 22% in the last seven days, while active addresses increased by 41%. This shows a growing interest in the digital asset despite the current losses.
CRO/USD 4-hour chart
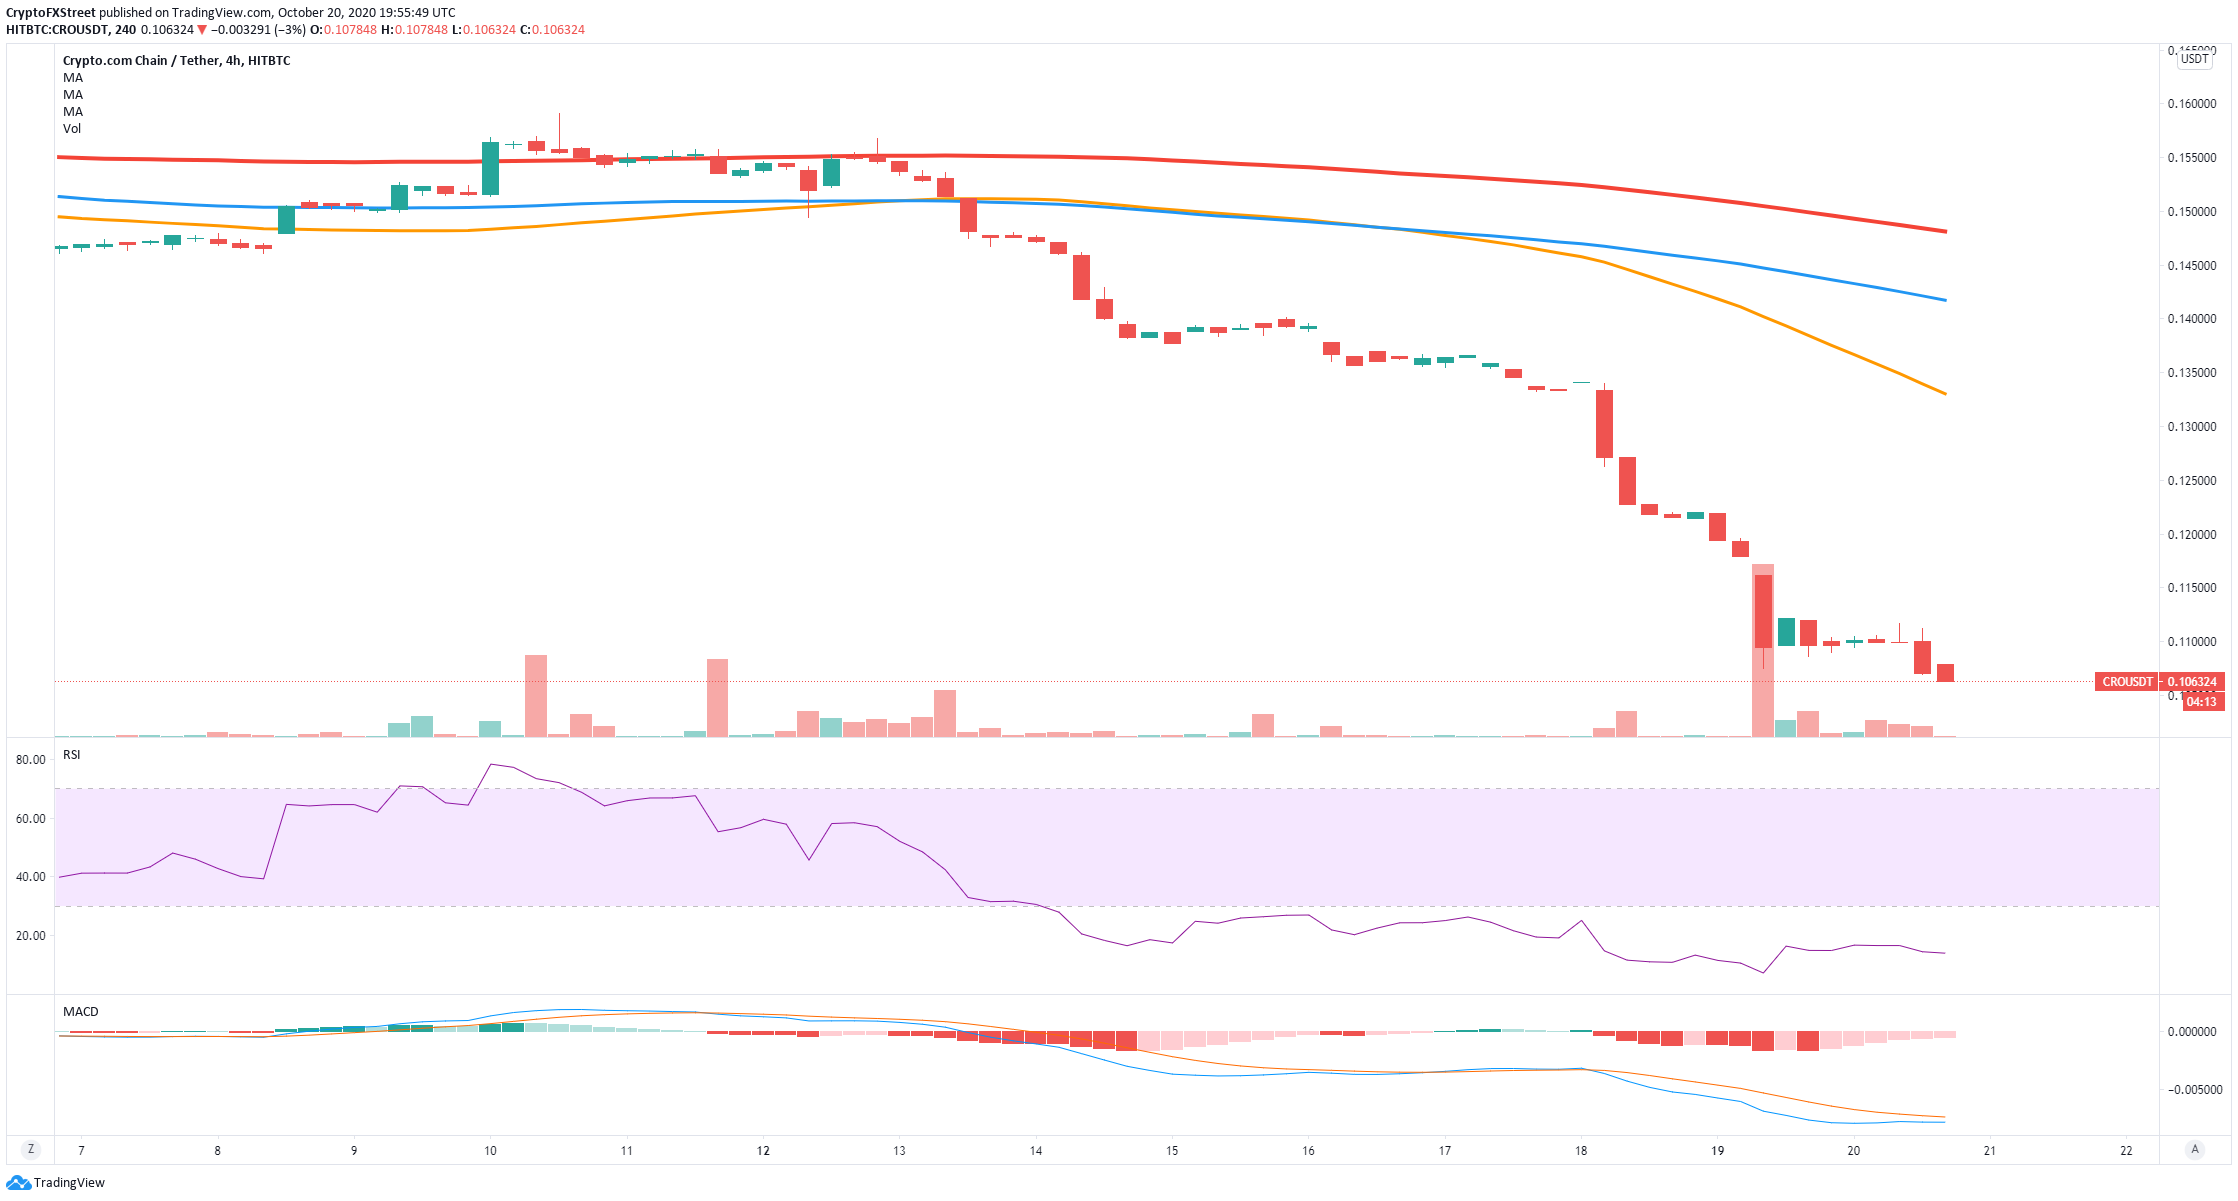
It seems that a bounce from the current price level can most likely take CRO up to the 50-SMA on the 4-hour chart, located at $0.133. The MACD is on the verge of turning bullish while the RSI remains heavily overextended which means a bounce is bound to happen sooner than later. Another potential price target for the bulls would be $0.141, the 100-SMA.
Crucial price points for CRO
It seems that CRO has been unable to recover from its top at $0.18 and continues falling without many signs of a bounce. A bearish breakout below $0.103 can drive the price of the digital asset down to $0.057.
On the flip side, despite the price falling quickly, the number of new addresses and active addresses of CRO is increasing. This renewed interest in the digital asset shows that some investors are willing to buy. A successful defense of the $0.103 support level can push CRO towards $0.133 and $0.141.
Author

Lorenzo Stroe
Independent Analyst
Lorenzo is an experienced Technical Analyst and Content Writer who has been working in the cryptocurrency industry since 2012. He also has a passion for trading.



