Crypto Today: BTC, ETH uptrend steadies amid spot ETF inflows, US-China trade talks
- Bitcoin retreats slightly but holds most of recent gains , buoyed by improving sentiment and positive spot ETF net flows.
- US-China trade talks extend to a second day in London, with optimism building for progress toward an eventual deal.
- Bitcoin and Ethereum spot ETFs post net inflow volumes, hinting at the return of institutional interest.
- Ethereum sustains the SuperTrend buy signal but faces strong resistance at $2,700, holding back breakout to $3,000.

The cryptocurrency market inches higher, bolstered by initial optimism for progress in the ongoing trade talks between the United States (US) and China. Bitcoin's (BTC) price hovers at around $109,462 at the time of writing on Tuesday, retreating slightly from Monday's close but keeping most of the gains seen on Monday.
The largest smart contracts token, Ethereum (ETH), is pushing against the upper range limit at around $2,700, reinforced by persistent institutional interest, as spot Exchange Traded Funds (ETFs) have marked a 15-day streak of net inflows.
Market overview: US-China trade talks continue
Top US and Chinese officials will resume trade talks for a second day in London on Tuesday as both countries aim to secure a deal on export controls for critical goods, such as rare earths, that threaten global supply chain disruption and slow economic growth.
Traders and investors are optimistic that the two economic giants can make progress towards an eventual trade agreement. The initial talks in Geneva last month extended relief to global markets, which had been battered by the escalation of tariffs in April.
According to Reuters, the US had raised concerns following the preliminary agreement, alleging that China was blocking the export of key materials necessary for the operation of sectors such as aerospace, autos, defense, and semiconductors.
Bitcoin led the recovery in the cryptocurrency market during the American session on Monday, rising to close near the day's high at around $110,263. The total market capitalization increased to $3.57 trillion from last week's drop to $3.29 trillion, signaling a broader bullish outlook.
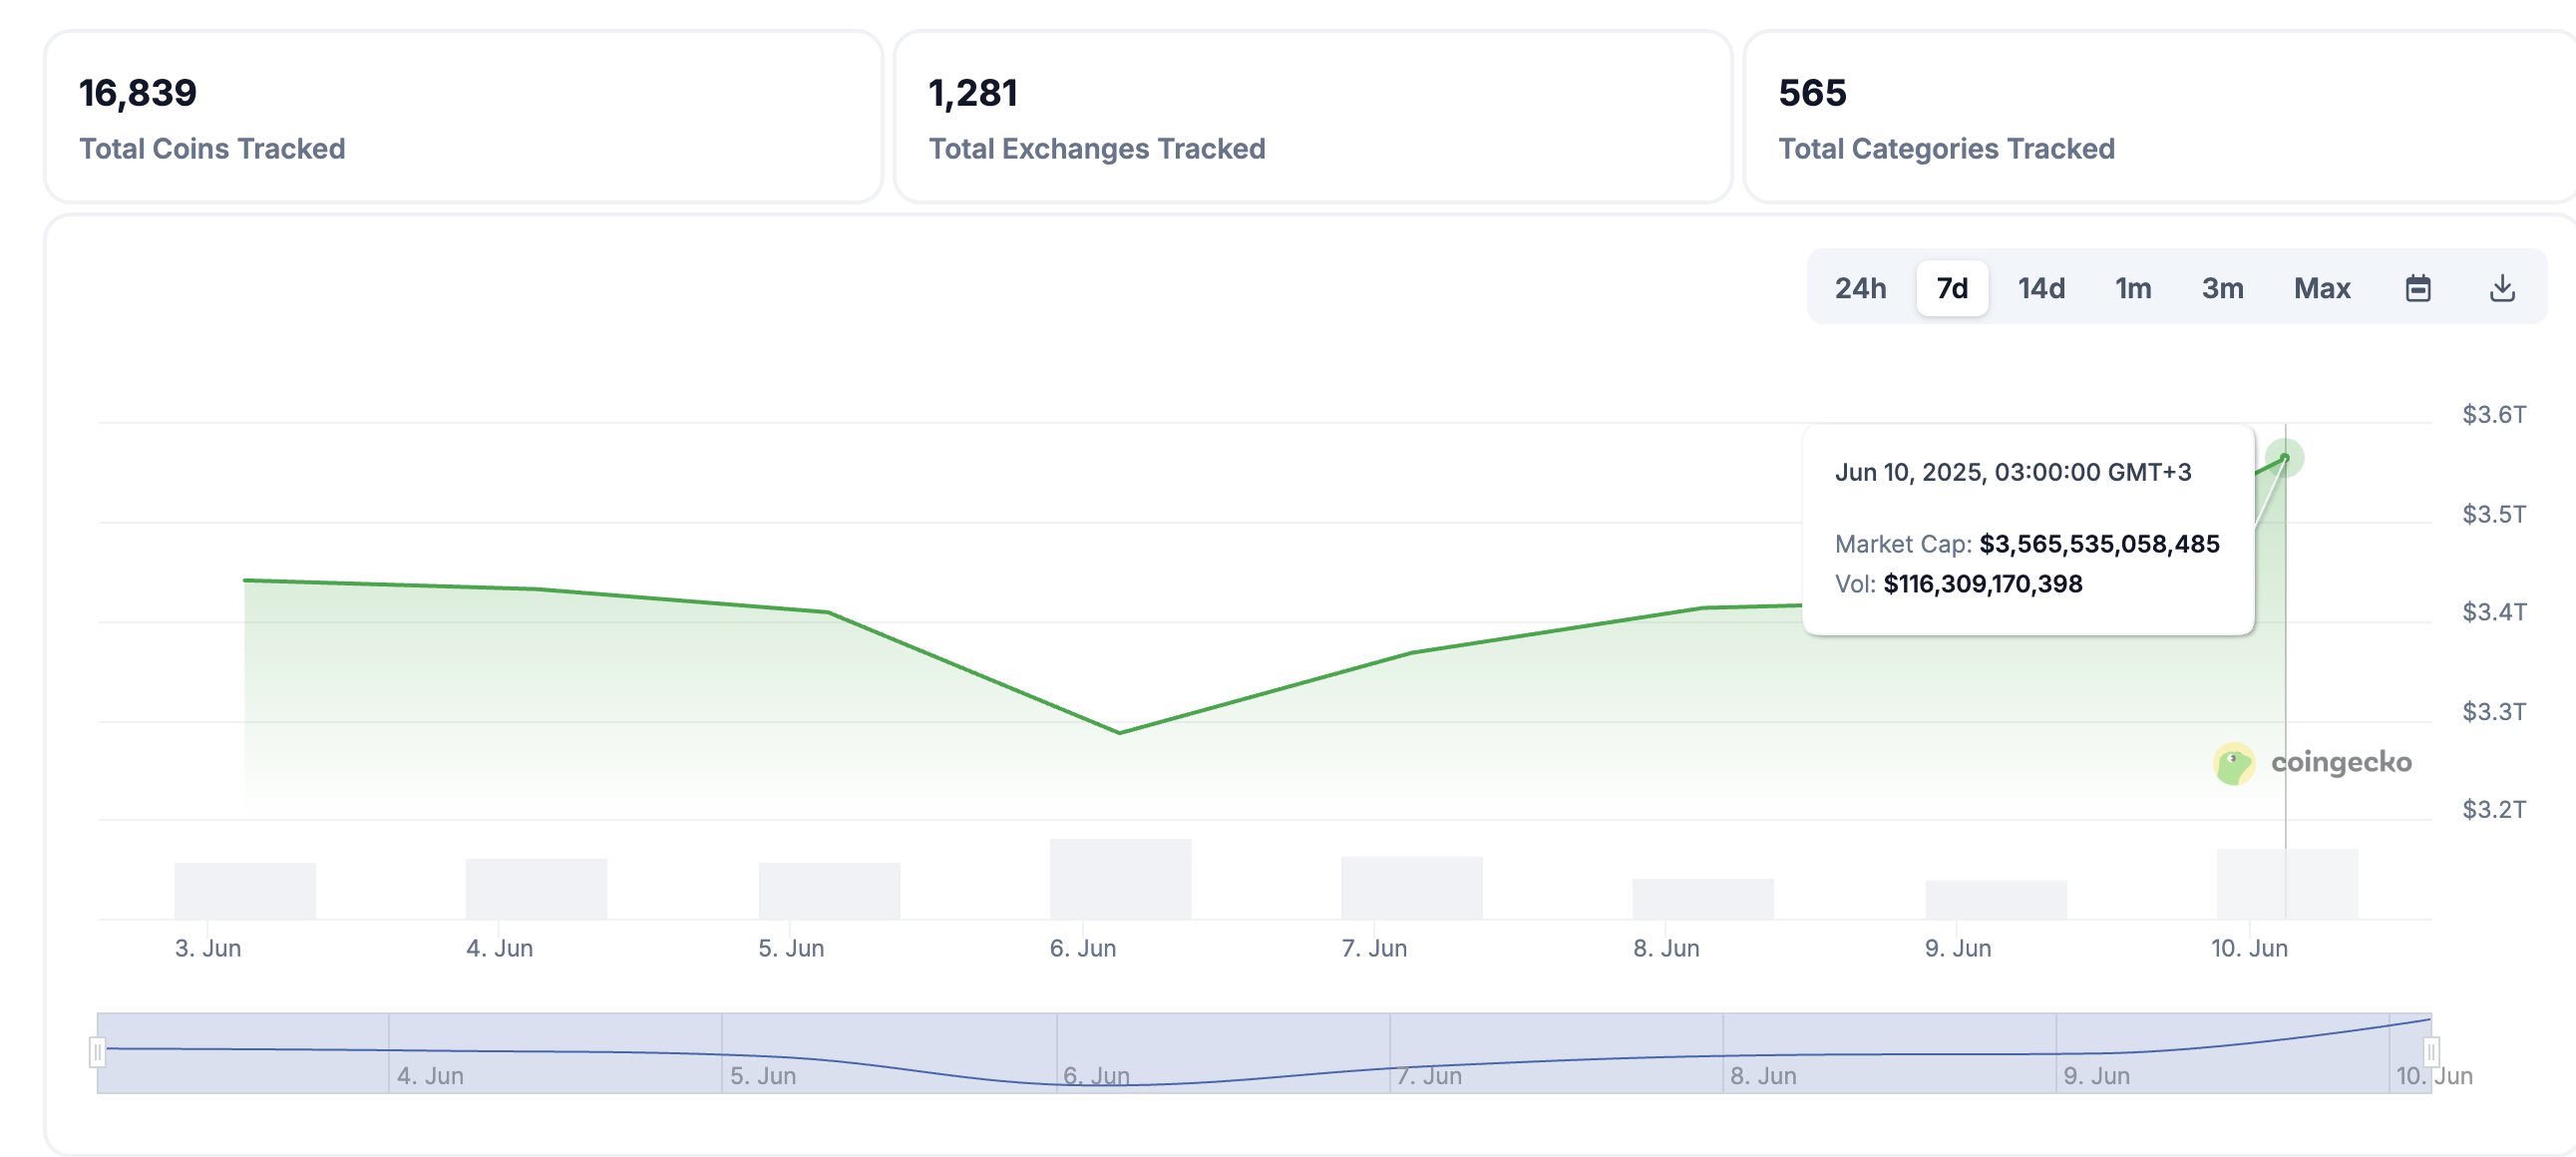
Crypto market capitalization | Source: CoinGecko
Data spotlight: Bitcoin and Ethereum spot ETFs post net inflows
Bitcoin spot ETFs resumed net inflows on Monday, with $386 million recorded after two consecutive days of outflows. Fidelity's BTC led with $173 million, while BlackRock's IBIT came in second position with $123 million. No ETF product posted outflows on Monday.
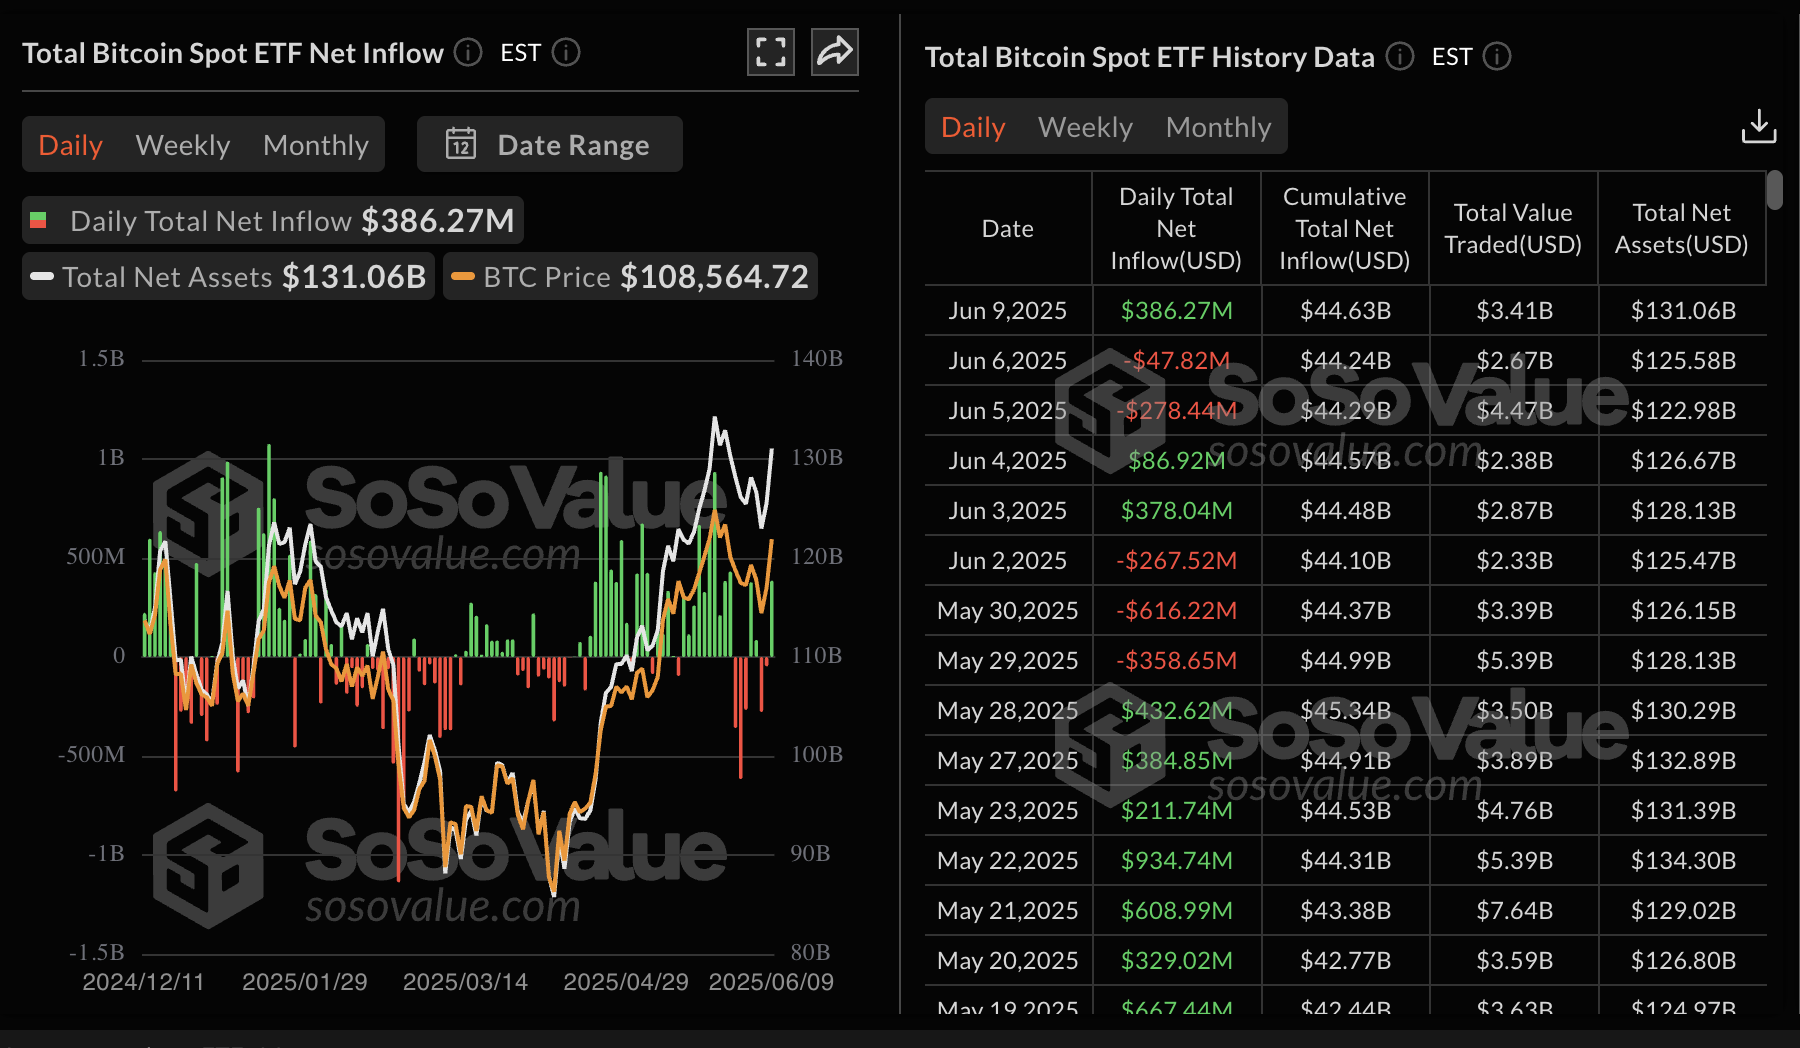
Bitcoin spot ETF stats | Source: SoSoValue
Ethereum spot ETFs saw an increase in inflow volume to $53 million on Monday, up from $25 million recorded on Friday. Interest in Ethereum-related products has steadied since the Pectra upgrade on May 7. Based on the chart below, ETH spot ETFs have sustained a 15-day streak, resulting in a cumulative net inflow of $3.38 billion.
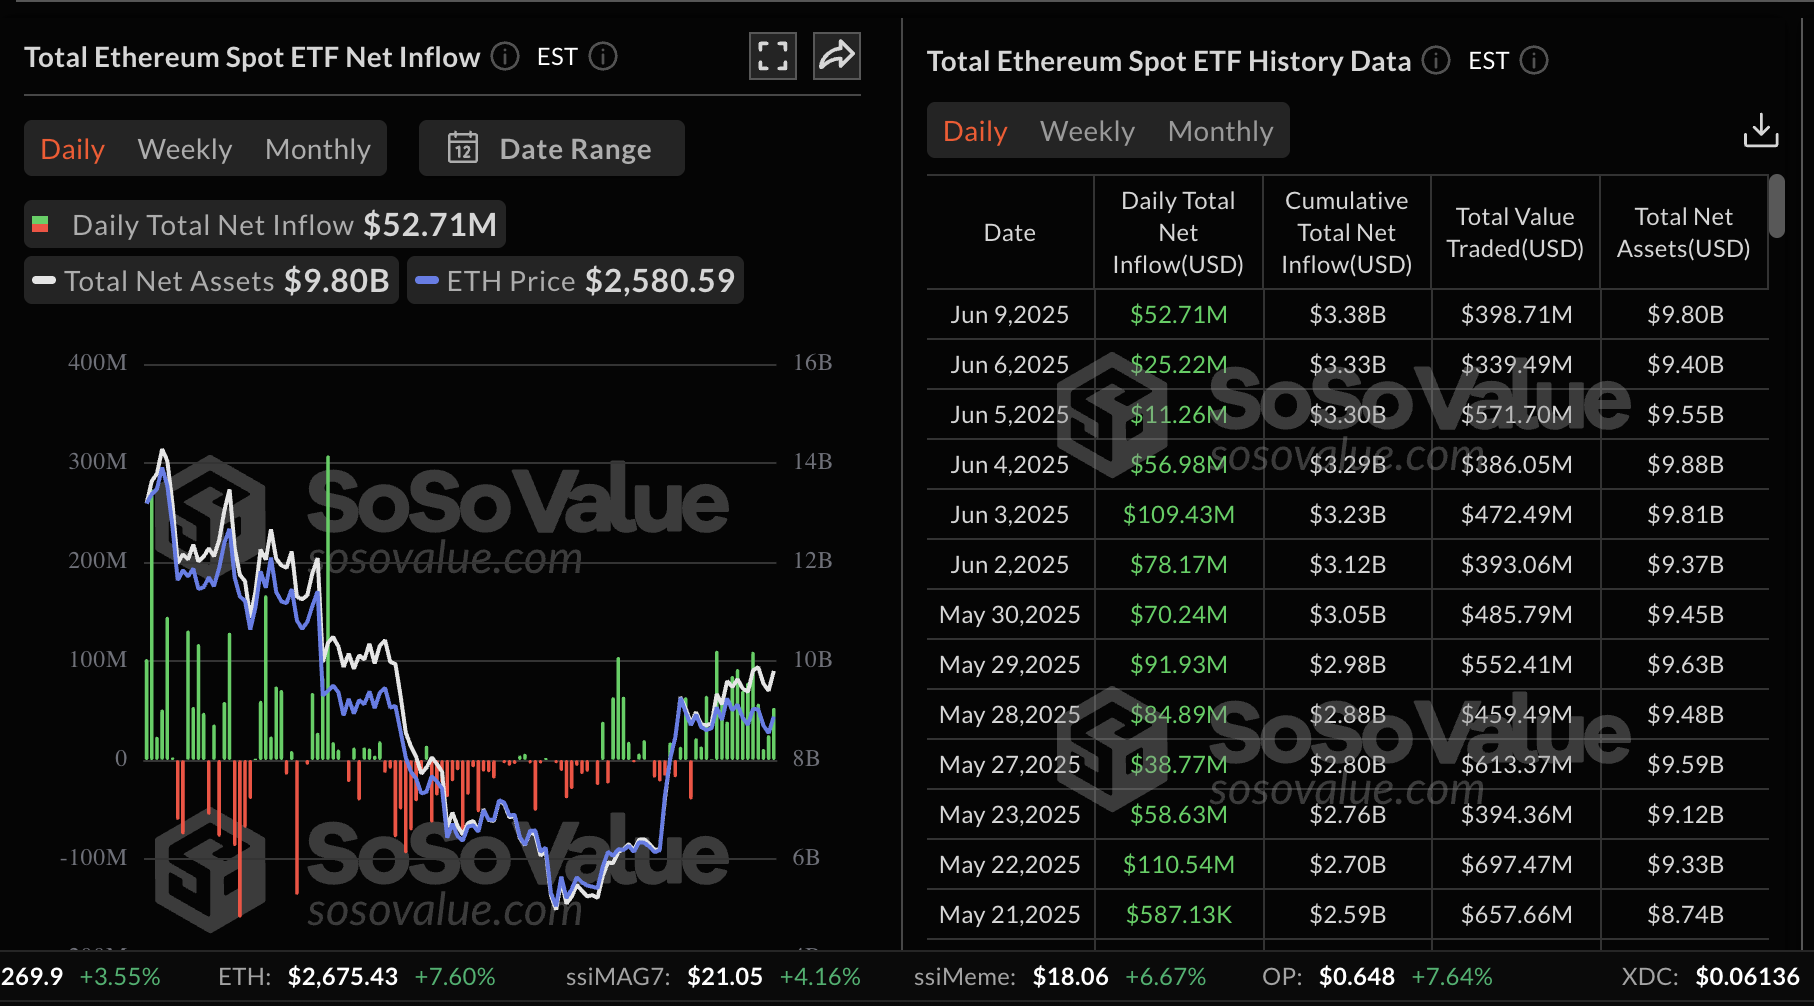
Ethereum spot ETF stats | Source: SoSoValue
Chart of the day: What's next as Bitcoin slips below $110,000?
Bitcoin's price wobbled after breaking above the critical $110,000 level, signaling trader exhaustion and potential profit-taking. The largest cryptocurrency hovers at around 109,462 at the time of writing, down almost 1% on the day.
On the bright side, BTC holds significantly above the uptrending moving averages, including the 50-day Exponential Moving Average (EMA) at approximately $101,972, the 100-day EMA at $97,627, and the 200-day EMA at $92,111, which highlights a robust bullish structure.
The Moving Average Convergence Divergence (MACD) indicator is close to provide a buy signal amid the current market conditions. The signal would manifest with the blue MACD line crossing above the red signal line, thereby encouraging traders to seek exposure to BTC.
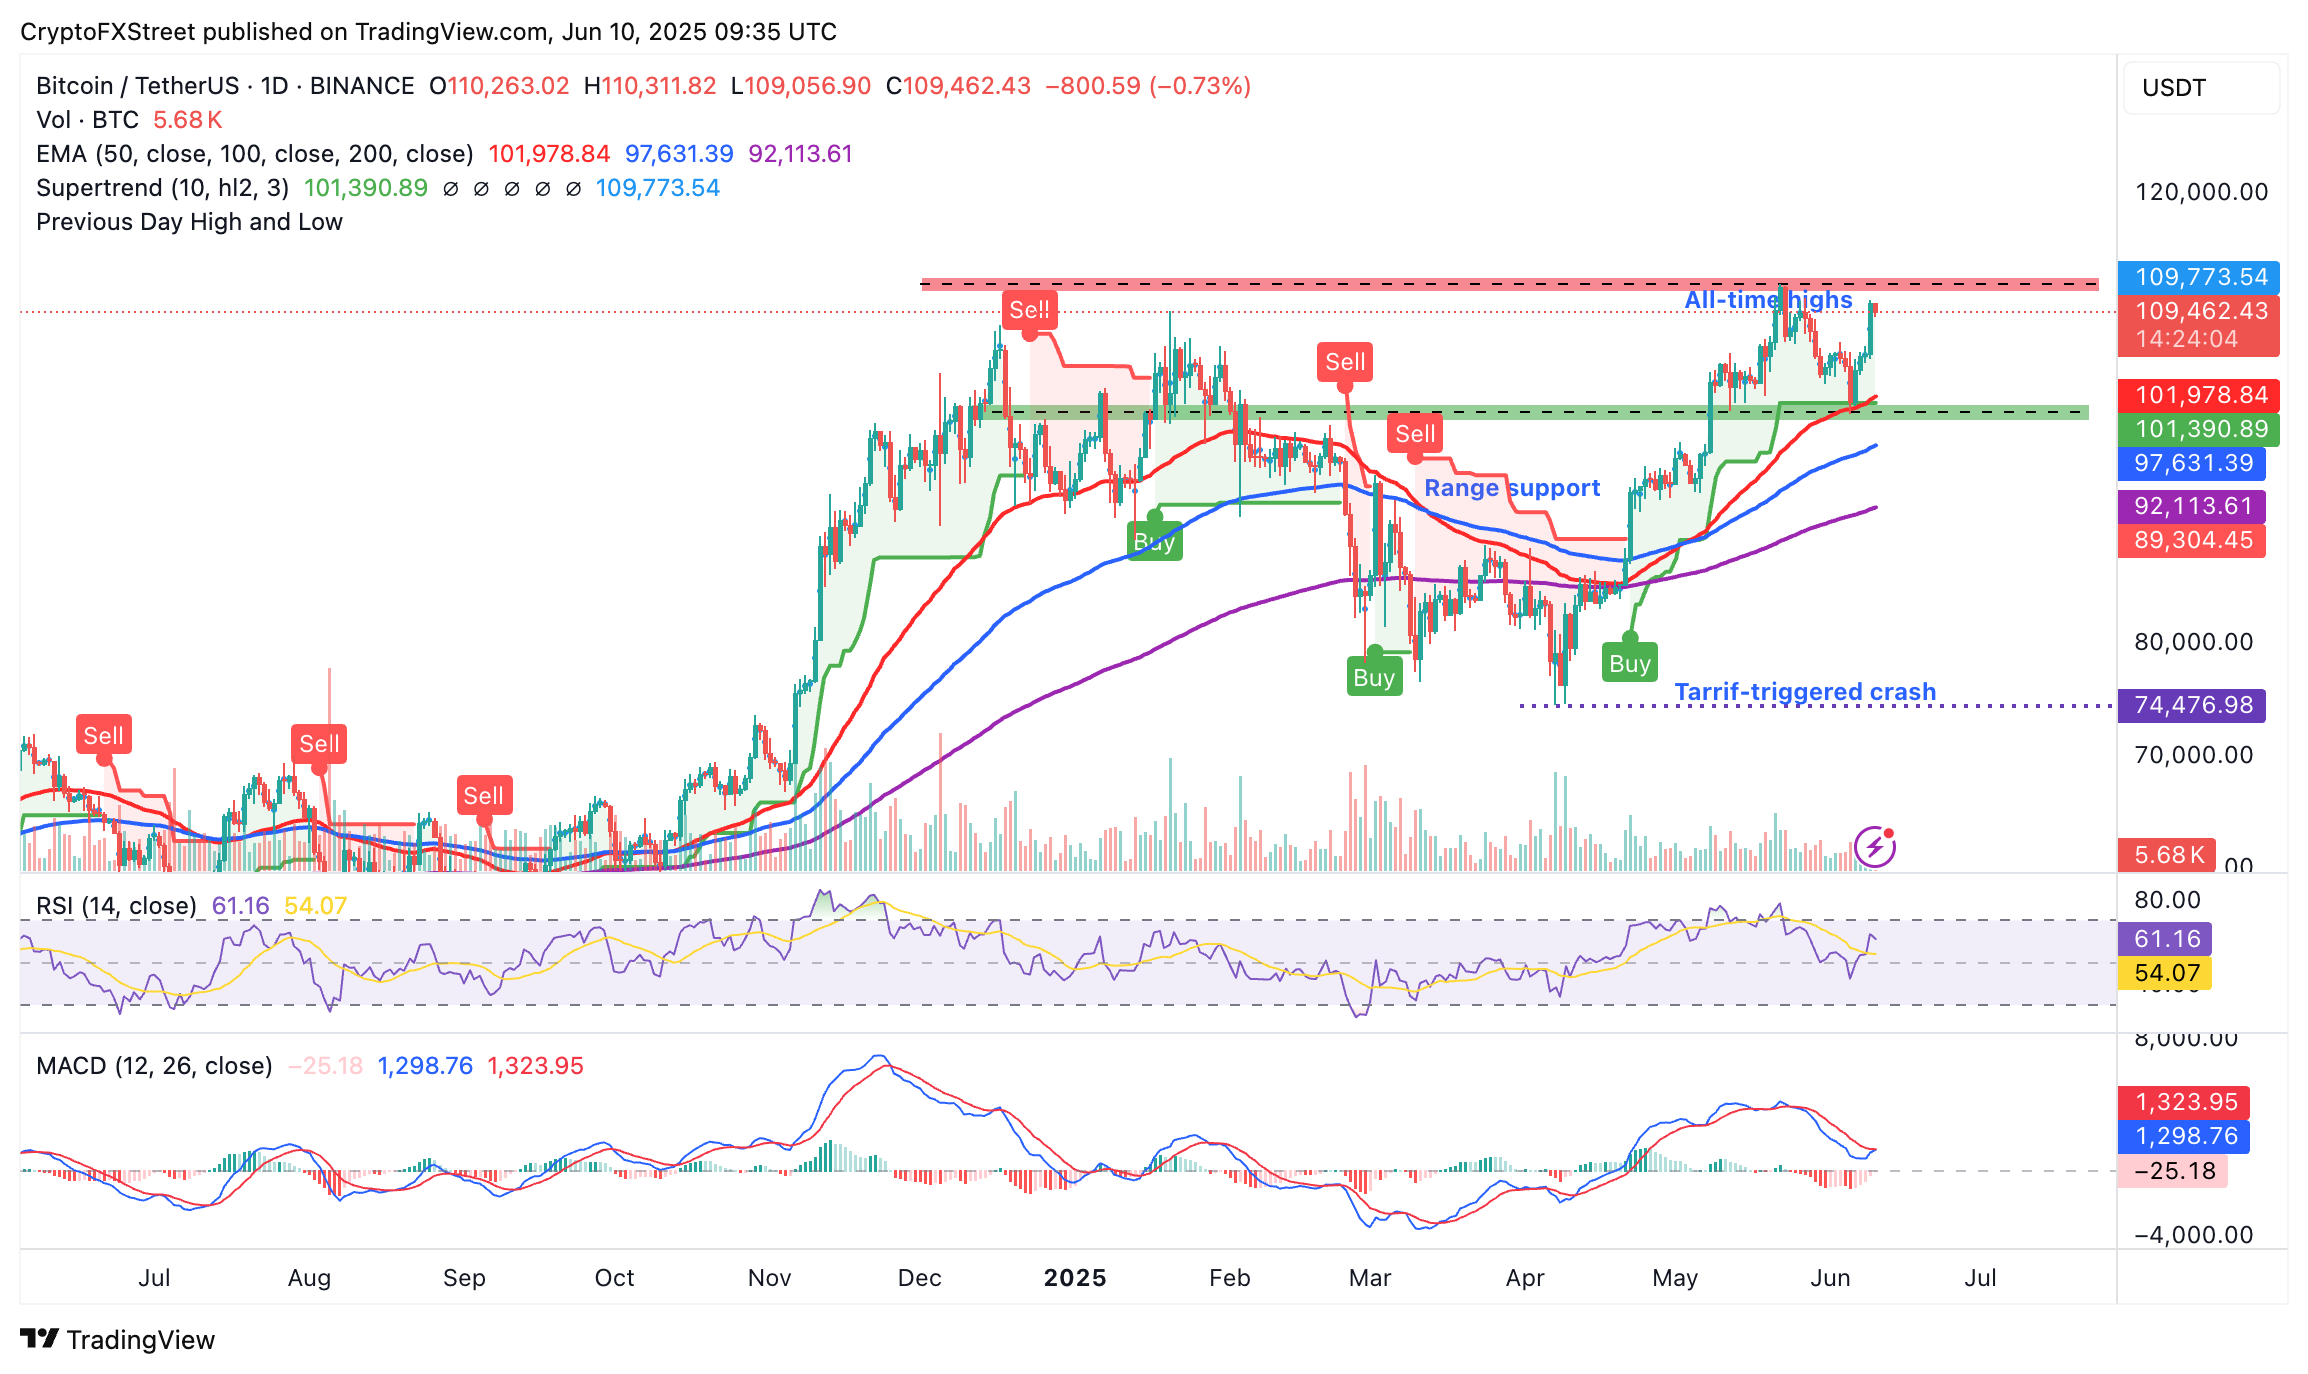
BTC/USD daily chart
An increase in demand for BTC could steady the uptrend above the resistance at $110,000, subsequently paving the way for a return to the all-time high of around $111,980. Beyond this level, BTC could activate the price discovery mode as traders expand the scope to $115,000 and $120,000.
Ethereum poised for breakout
Ethereum's price tests the range resistance at around $2,700 as it extends gains from support at approximately $2,387. Its downside is protected by the presence of the 200-day EMA at $2,465, the 50-day EMA at $2,377, and the 100-day EMA at $2,230, implying that the path of least resistance remains upward.
The Relative Strength Index (RSI) remains at 62, having risen from lows slightly below the 50 midline. A movement toward the overbought territory above 70 could signal a strong bullish momentum.
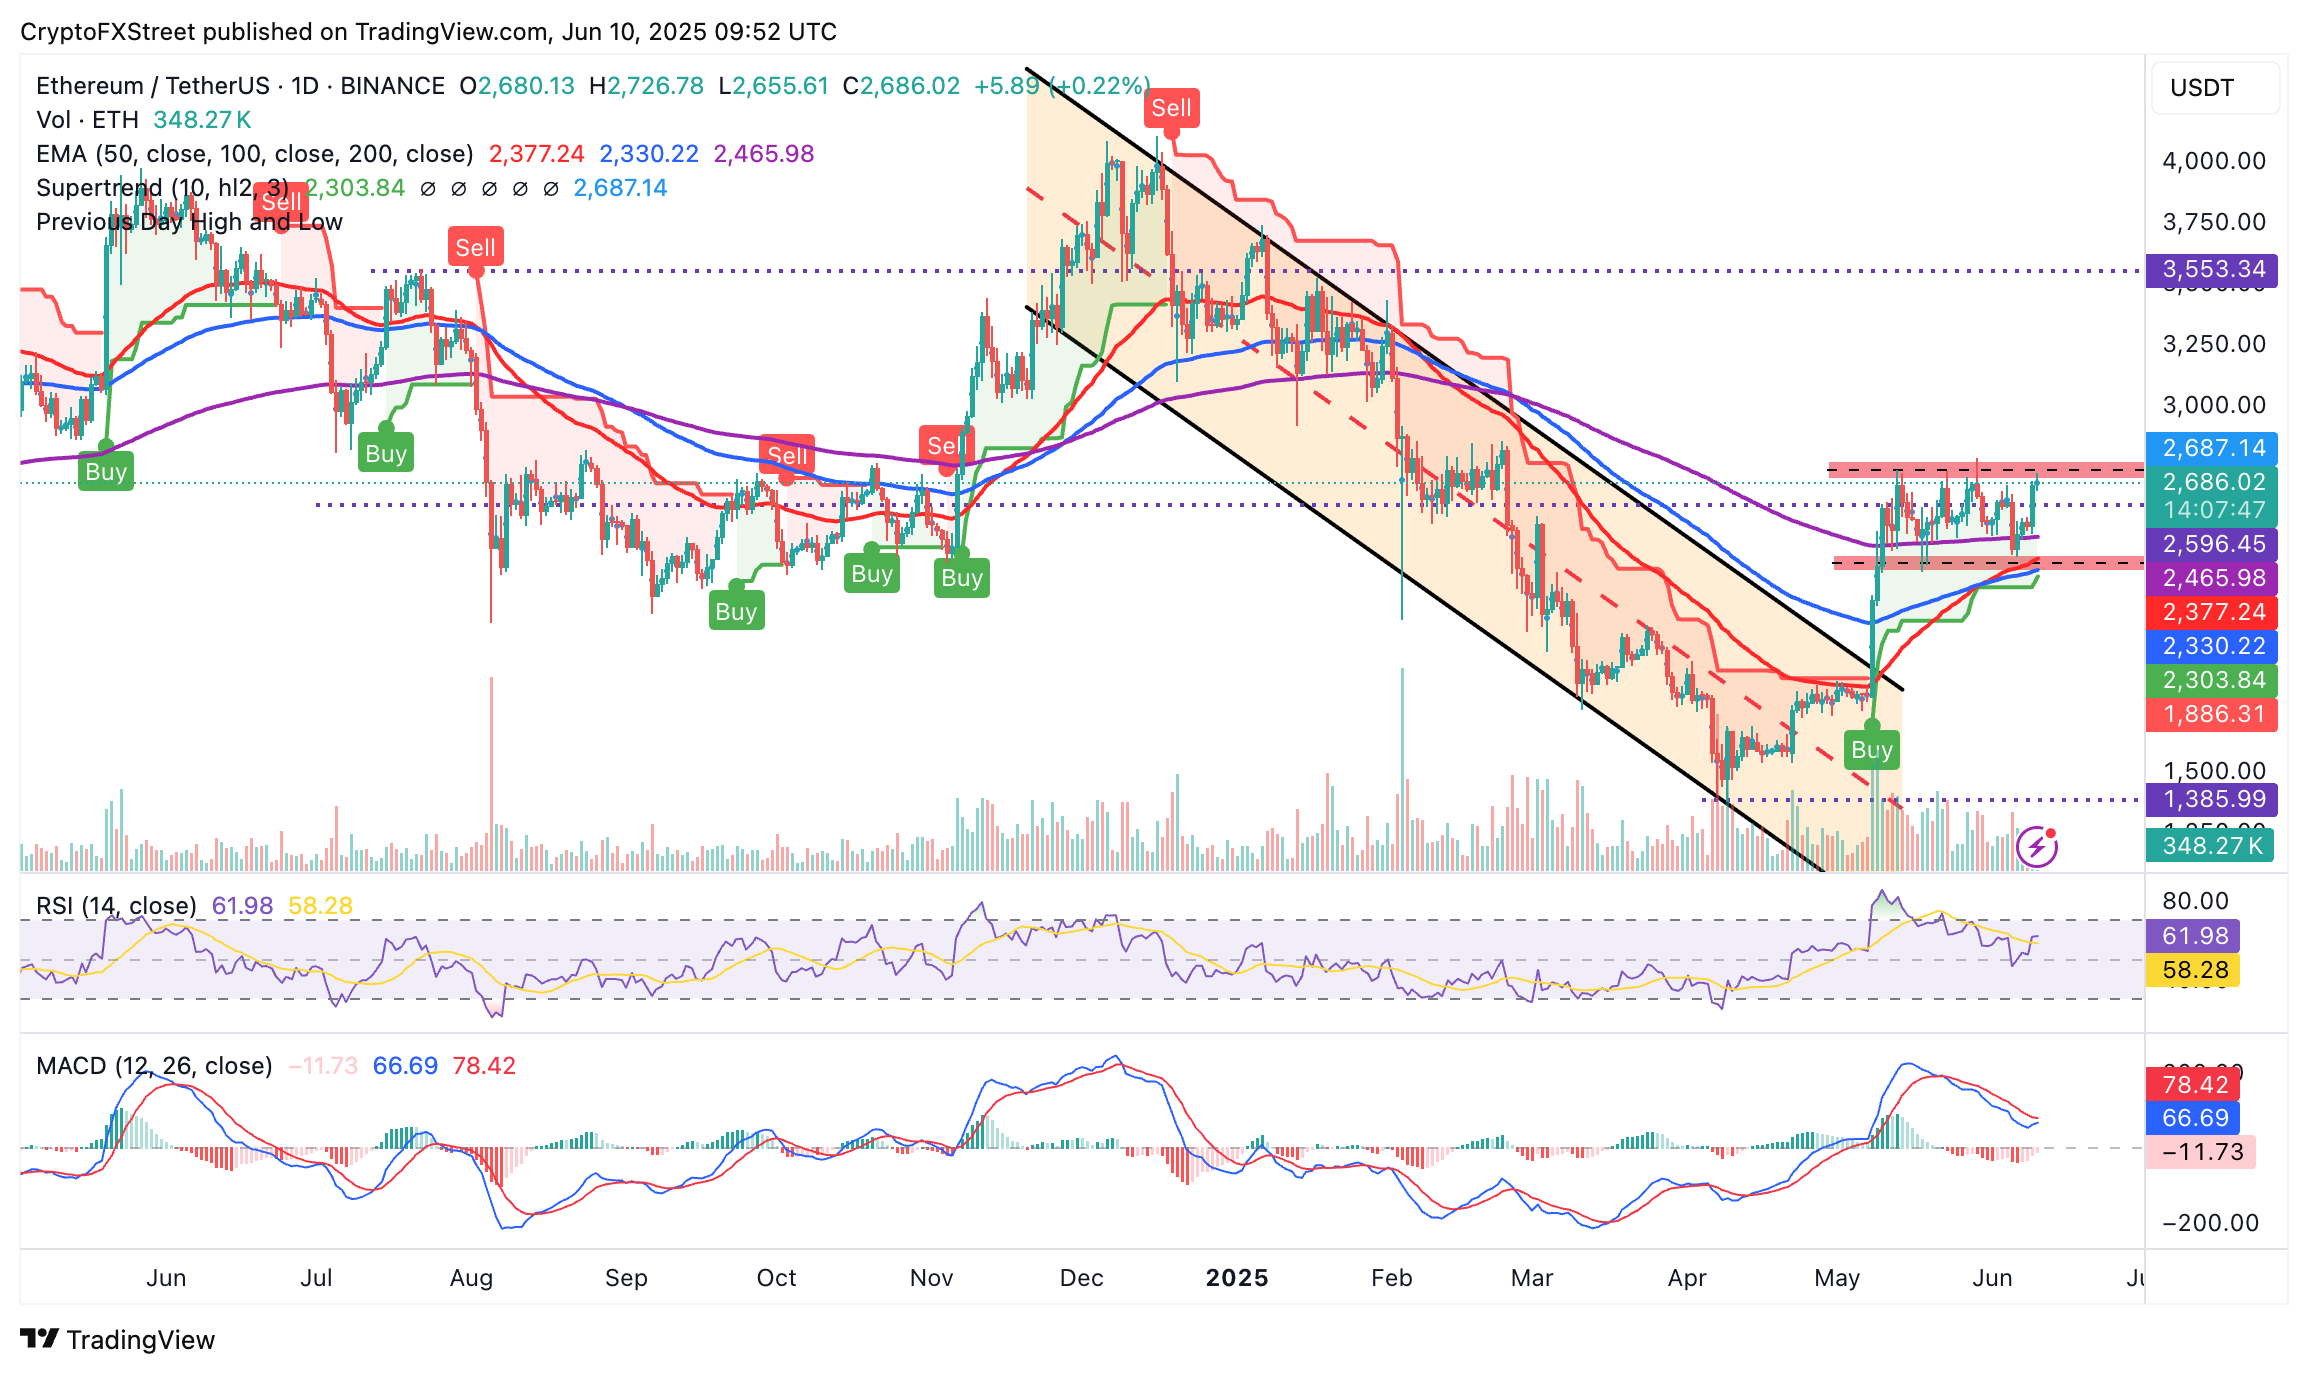
ETH/USDT daily chart
Traders seeking validation of the uptrend ahead of a potential breakout targeting highs of $3,000 would look out for a buy signal likely to be sent by the Moving Average Convergence Divergence (MACD) indicator.
Cryptocurrency metrics FAQs
The developer or creator of each cryptocurrency decides on the total number of tokens that can be minted or issued. Only a certain number of these assets can be minted by mining, staking or other mechanisms. This is defined by the algorithm of the underlying blockchain technology. On the other hand, circulating supply can also be decreased via actions such as burning tokens, or mistakenly sending assets to addresses of other incompatible blockchains.
Market capitalization is the result of multiplying the circulating supply of a certain asset by the asset’s current market value.
Trading volume refers to the total number of tokens for a specific asset that has been transacted or exchanged between buyers and sellers within set trading hours, for example, 24 hours. It is used to gauge market sentiment, this metric combines all volumes on centralized exchanges and decentralized exchanges. Increasing trading volume often denotes the demand for a certain asset as more people are buying and selling the cryptocurrency.
Funding rates are a concept designed to encourage traders to take positions and ensure perpetual contract prices match spot markets. It defines a mechanism by exchanges to ensure that future prices and index prices periodic payments regularly converge. When the funding rate is positive, the price of the perpetual contract is higher than the mark price. This means traders who are bullish and have opened long positions pay traders who are in short positions. On the other hand, a negative funding rate means perpetual prices are below the mark price, and hence traders with short positions pay traders who have opened long positions.
Author

John Isige
FXStreet
John Isige is a seasoned cryptocurrency journalist and markets analyst committed to delivering high-quality, actionable insights tailored to traders, investors, and crypto enthusiasts. He enjoys deep dives into emerging Web3 tren


