Crypto Today: Bitcoin's downside risks escalate as BTC spot ETF outflows extend
- Bitcoin fails to sustain its recovery above $106,000 as global economic tensions continue to shake markets; technical indicators highlight a strengthening bearish structure.
- Bitcoin spot ETFs saw a total net outflow of $268 million on Monday, marking three consecutive days of outflows.
- Ethereum spot ETFs sustain bullish outlook after recording $78 million in net inflows.
- Ethereum consolidates above $2,600 support as key up-trending moving averages increase the probability of gains toward $3,000.

The cryptocurrency market is consolidating losses after starting the week amid high volatility. Bitcoin (BTC) attempted to steady the uptrend above $106,000 but lost steam, resulting in a reversal to $105,204 at the time of writing on Tuesday.
The drop in sentiment due to uncertainty in the global macroeconomic environment, as tariff tensions rattle investors, could be a major catalyst, escalating sell-side pressure on cryptos. Bitcoin spot Exchange Traded Funds (ETFs) registered their third consecutive day of outflows on Monday after breaking a persistent 10-day inflow trend last week.
Market overview: Profit taking and global trade uncertainty subdue crypto prices
Bitcoin’s reversal from new all-time highs of around $111,980 spread uncertainty in the crypto market, putting more brakes on the much-awaited altcoin season. Furthermore, trade tensions due to United States (US) tariff uncertainty have caused investors to become jittery or even quick to take profits, which hinders price recovery.
However, Crypto Finance’s outlook on Bitcoin suggests that this correction is healthy behavior and is often synonymous with price discovery phases.
“This price behavior is entirely logical—we are in a new phase of price discovery, and it is natural to see both profit-taking and hesitancy to chase the rally despite supportive headlines,” Crypto Finance said in Tuesday’s market outlook. “This dynamic is visible across both spot and derivatives markets,” the analysts added.
Meanwhile, Ethereum (ETH) paints a more stable technical structure compared to Bitcoin, supported by steady spot ETF inflows. CoinShares’ weekly digital asset report, released every Monday, highlighted that Ethereum led inflows, marking the strongest run since 2024.
“Ethereum Surges, Bitcoin Pauses: Ethereum led with US$321m in inflows — its best 6-week run since December 2024 — while Bitcoin saw a reversal mid-week, ending with US$8m in outflows,” CoinShares weekly report states.
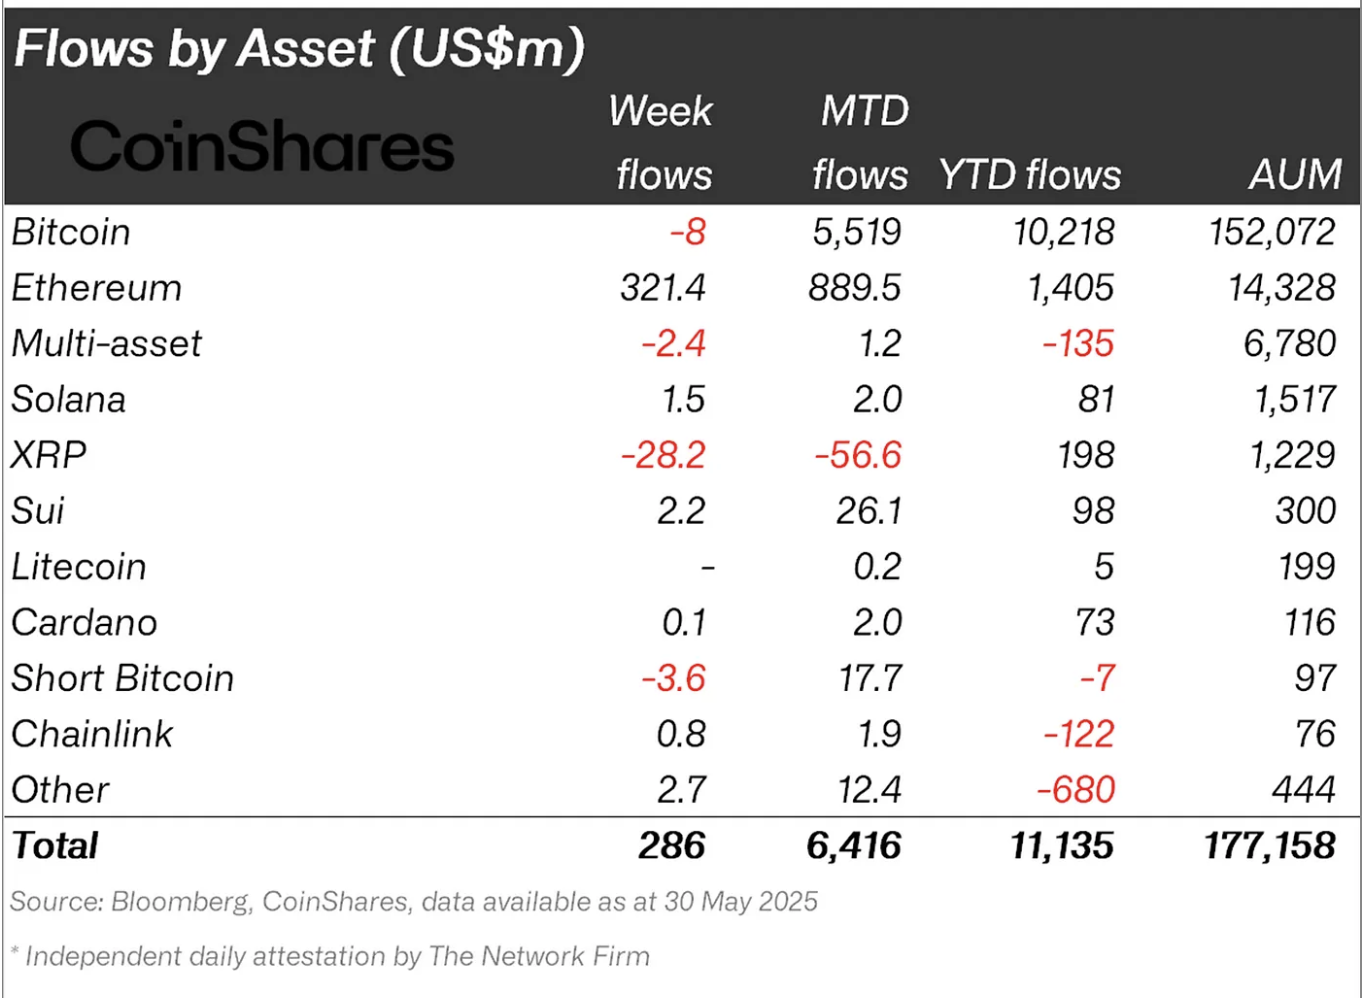
Digital asset fund flows | Source CoinShares
Data spotlight: BTC spot ETF outflows surge
Bitcoin spot ETFs saw approximately $268 million in net outflow volume on Monday, marking the third consecutive day of outflows in a row. As of May 29, BTC spot ETFs had sustained an impressive 10-day net inflow trend, as shown in the chart below. Apart from Bitwise’s BITB ETF, the rest of the ETF products licensed to operate in the US posted either net inflows or zero flows on Monday.
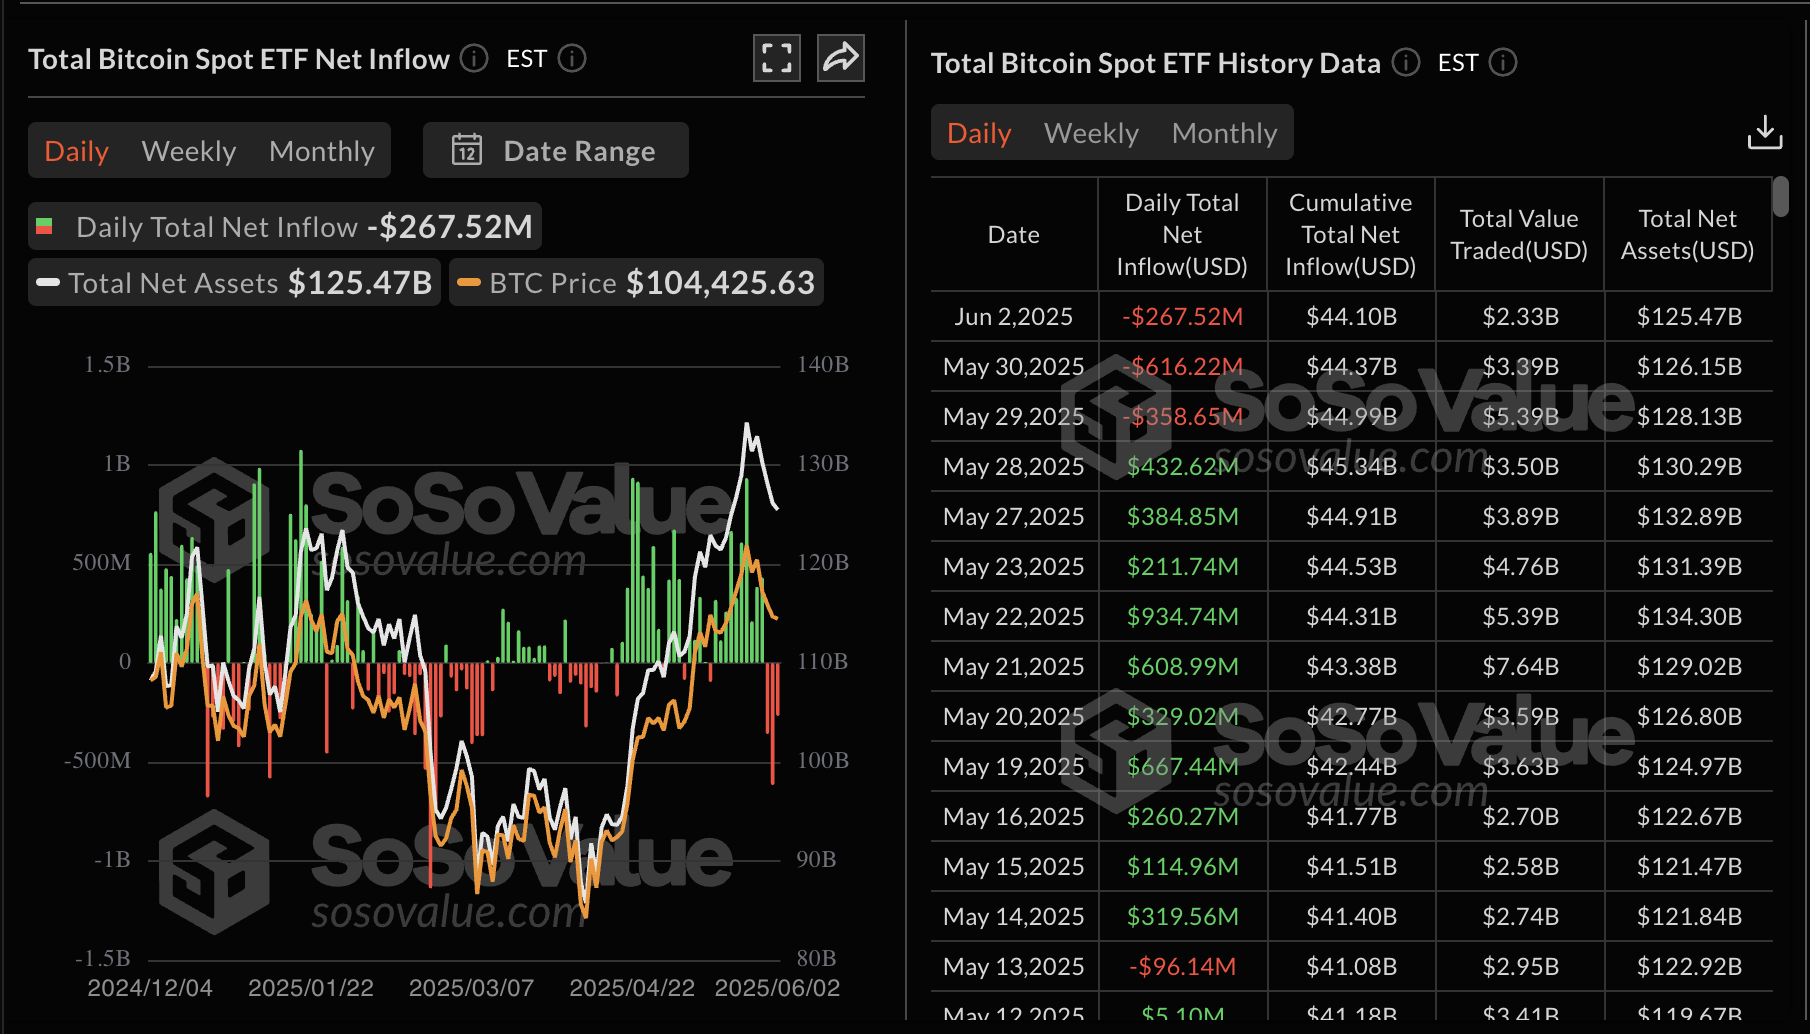
Bitcoin spot ETF stats | Source: SoSoValue
Ethereum spot ETFs steady the inflow trend this week, recording over $78 million in net inflows on Monday. The 11-day net inflow trend has pushed the cumulative total net inflow to $3.12 billion. Interest in the largest smart contracts token has been on the rise since the Pectra upgrade in May, boosting sentiment while keeping the price elevated around the $2,600 support level.
“Ethereum led the pack this week, with another week of inflows totalling US$321m, bringing this 6 consecutive week run of inflows to US$1.19bn, its strongest run since December 2024, marking a decisive improvement in sentiment,” CoinShares weekly digital asset flows report highlights.
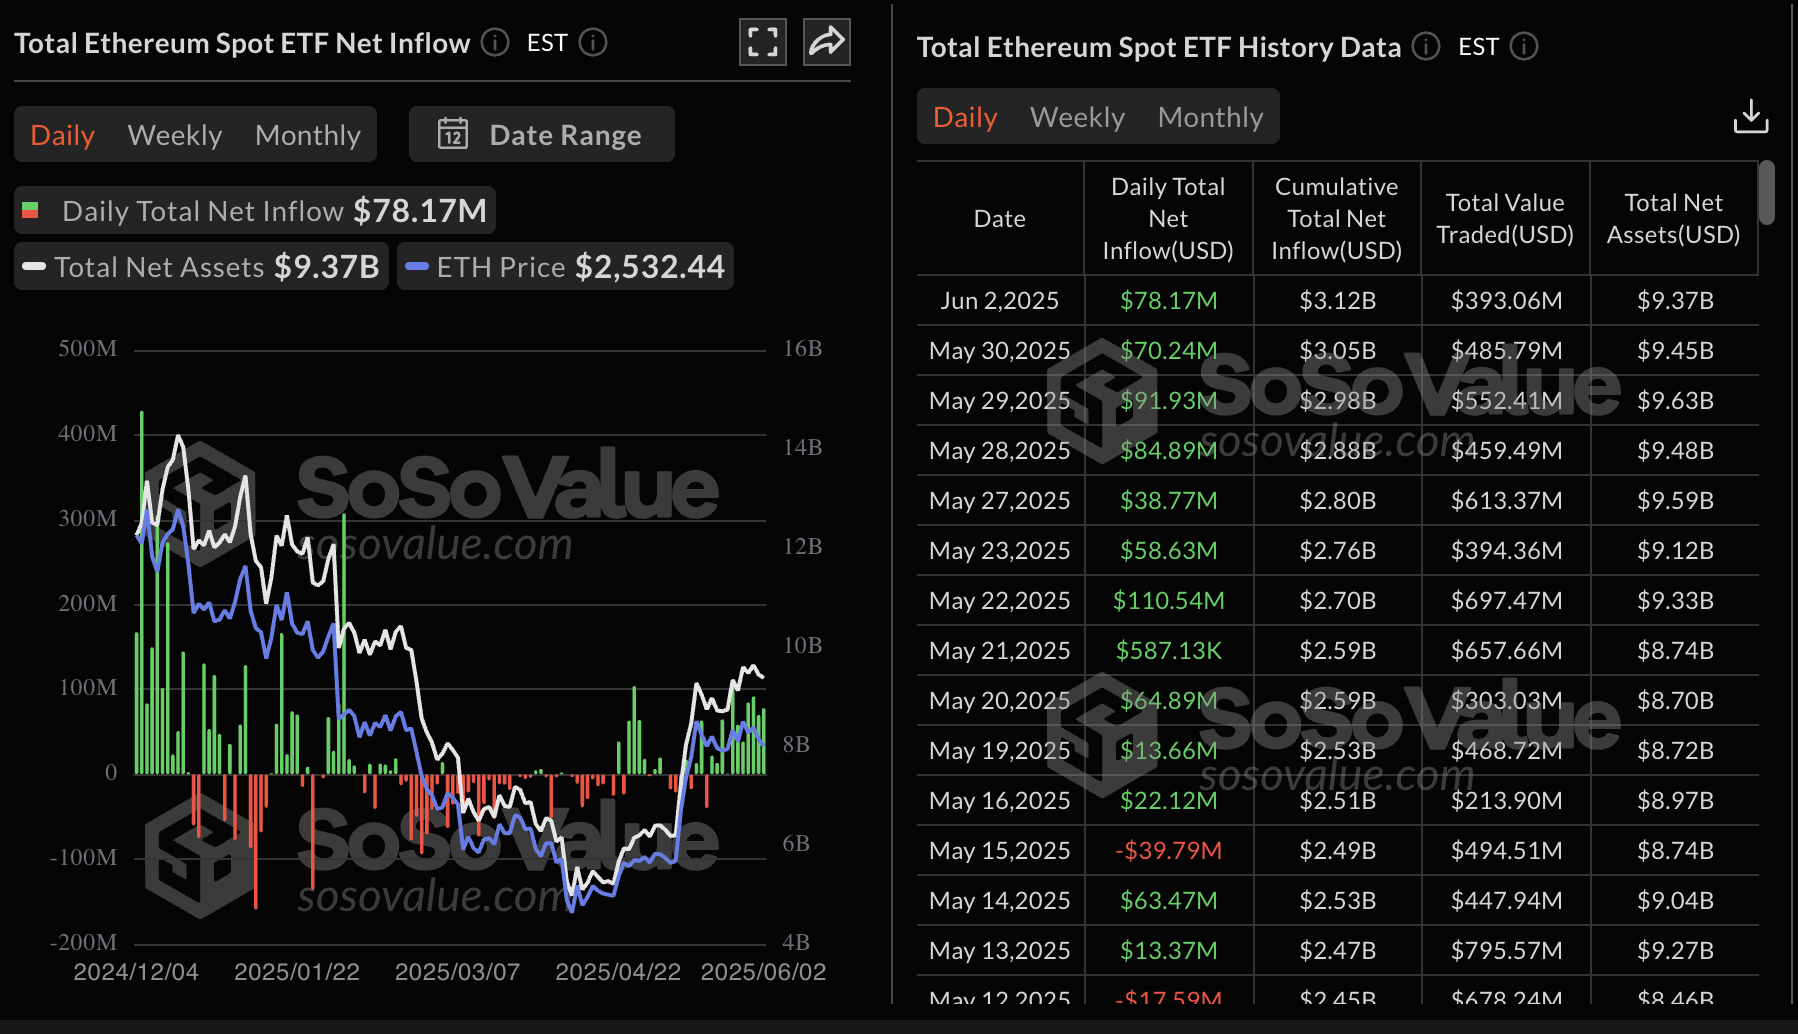
Ethereum spot ETF stats | Source: SoSoValue
Chart of the day: Bitcoin faces growing downside risks
Bitcoin’s price hovers around $105,204 at the time of writing, down slightly on the day. The general outlook remains bearish, underpinned by the Moving Average Convergence Divergence (MACD) indicator, which has been maintaining a sell signal since May 25. This signal occurs when the blue MACD line crosses below the red signal line, making shorts attractive to traders. The expanding red histogram bars beneath the zero line (0.00) on the daily chart below suggest that sellers have the upper hand, at least for now.
Beyond the immediate support at the $105,000 round level, traders may want to pay attention to the area around $103,100, which was tested on Saturday. Other key levels to monitor for potential support include the 50-day Exponential Moving Average (EMA) at 100,633, the 100-day EMA at $96,366 and the 200-day EMA at $91,106.
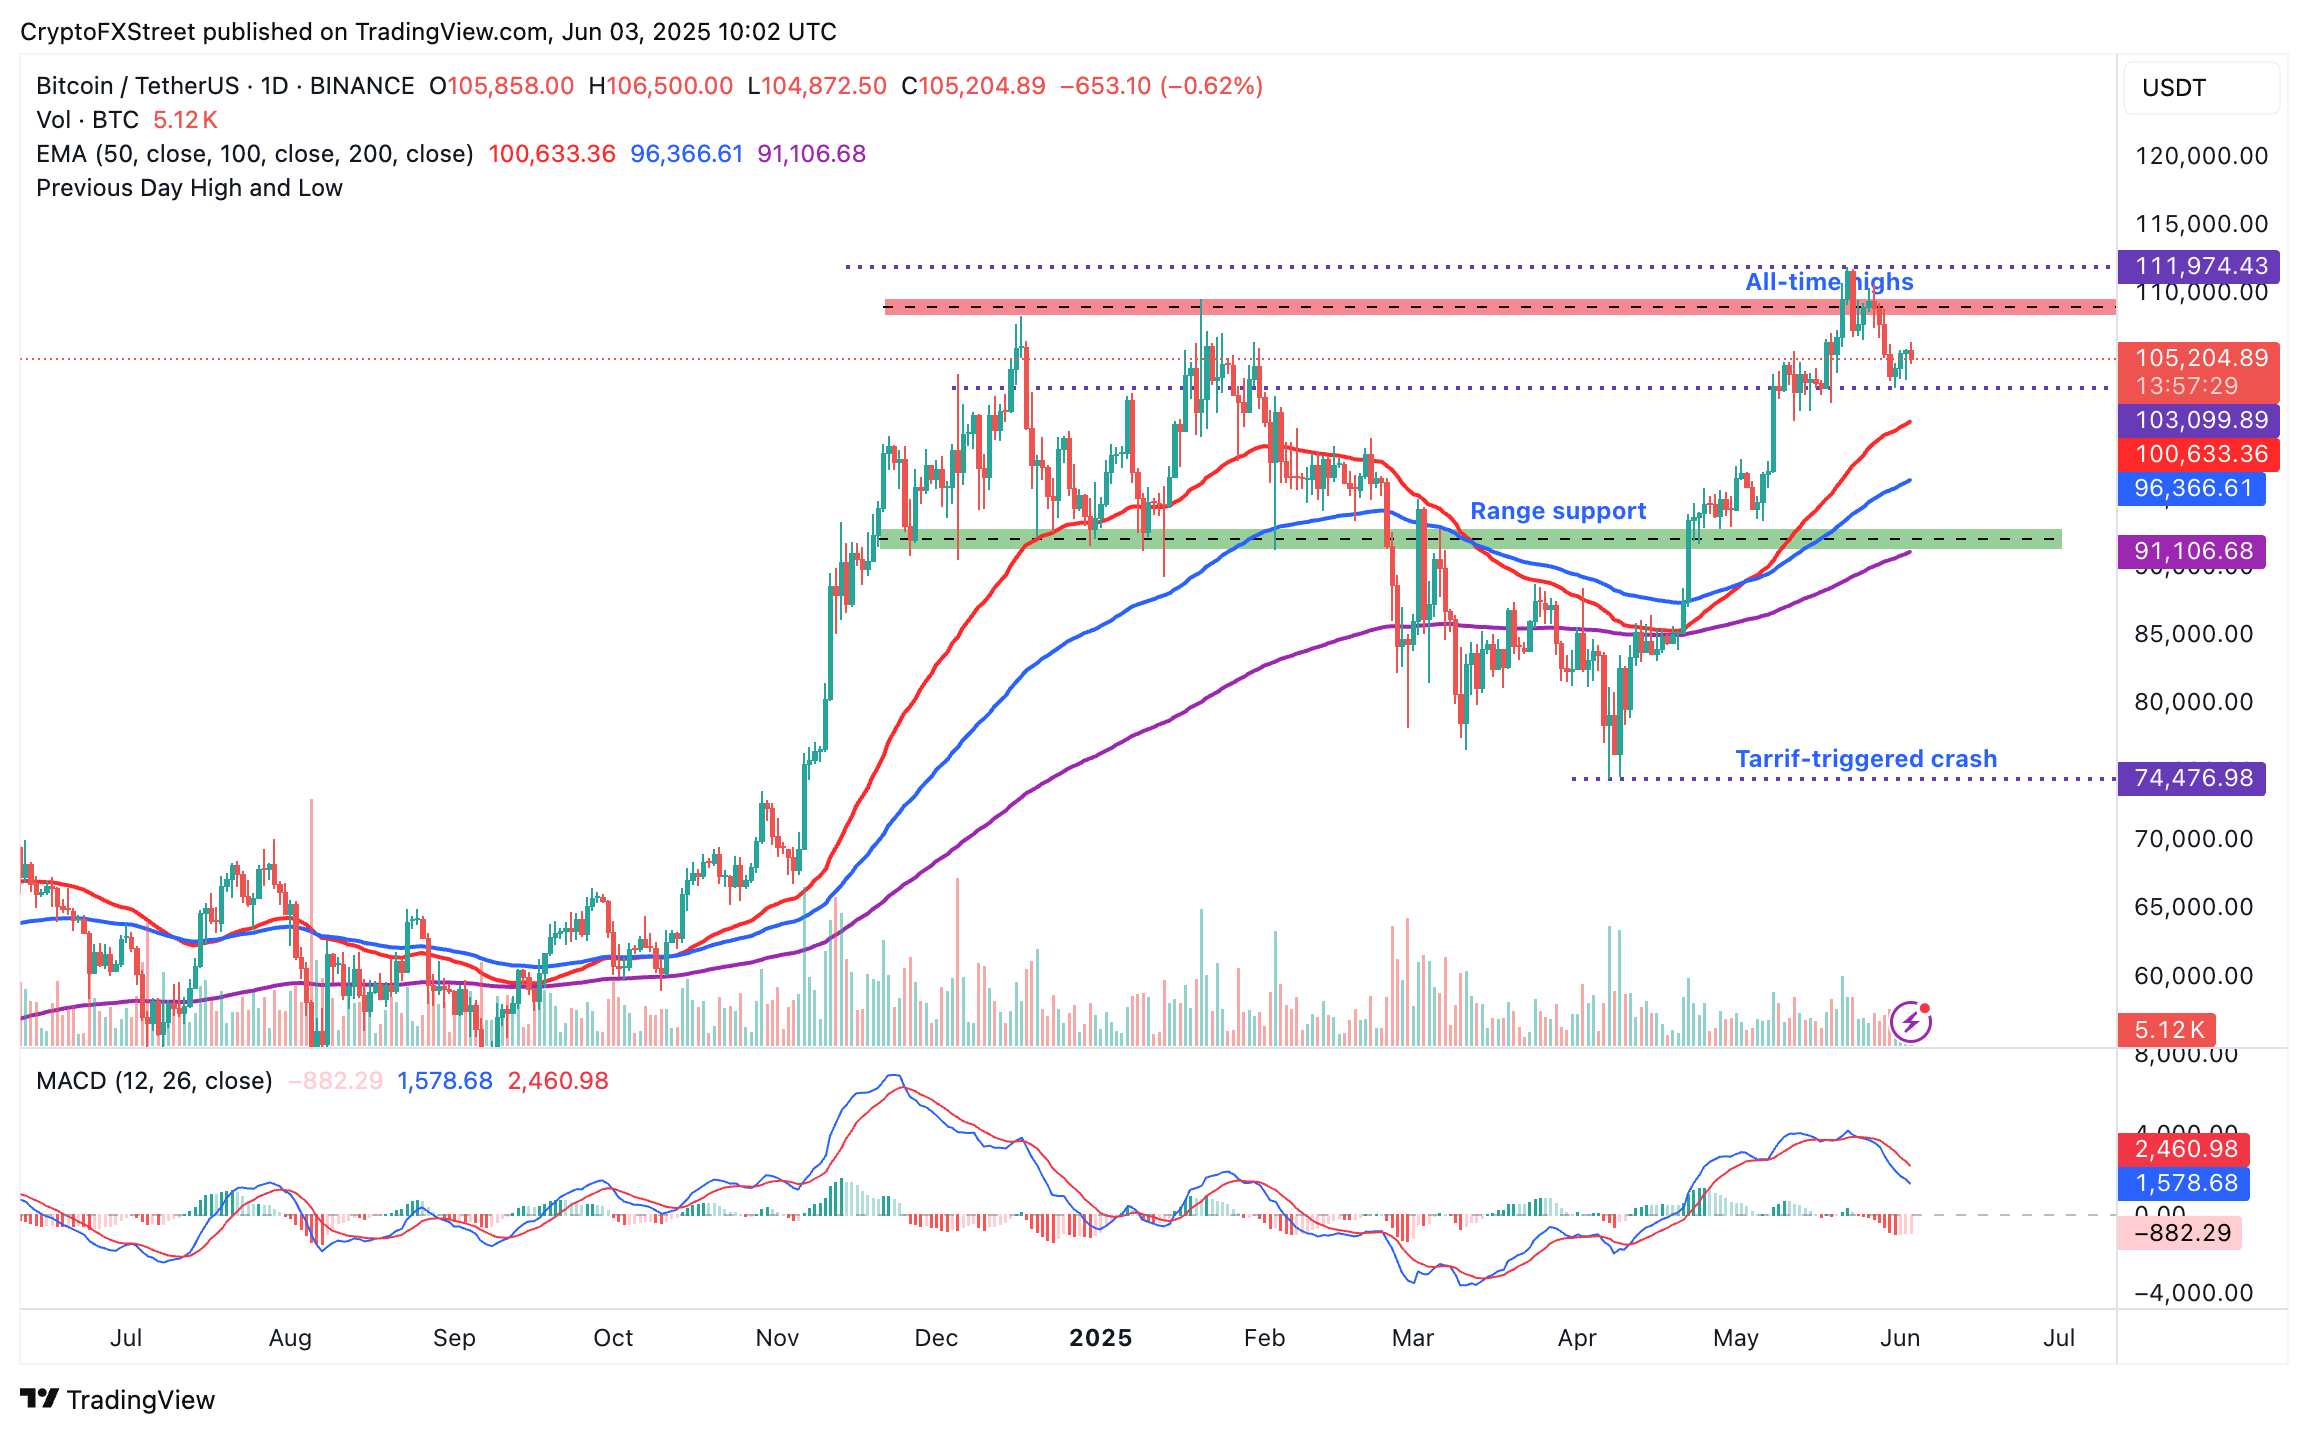
BTC/USDT daily chart
On the other hand, Ethereum is consolidating above the pivotal support level at $2,600, currently trading at $2,617 at the time of writing. The 200-day EMA reinforces the short-term range support at $2,459, which, if respected in upcoming sessions, could increase the probability of a breakout toward the coveted $3,000 target.
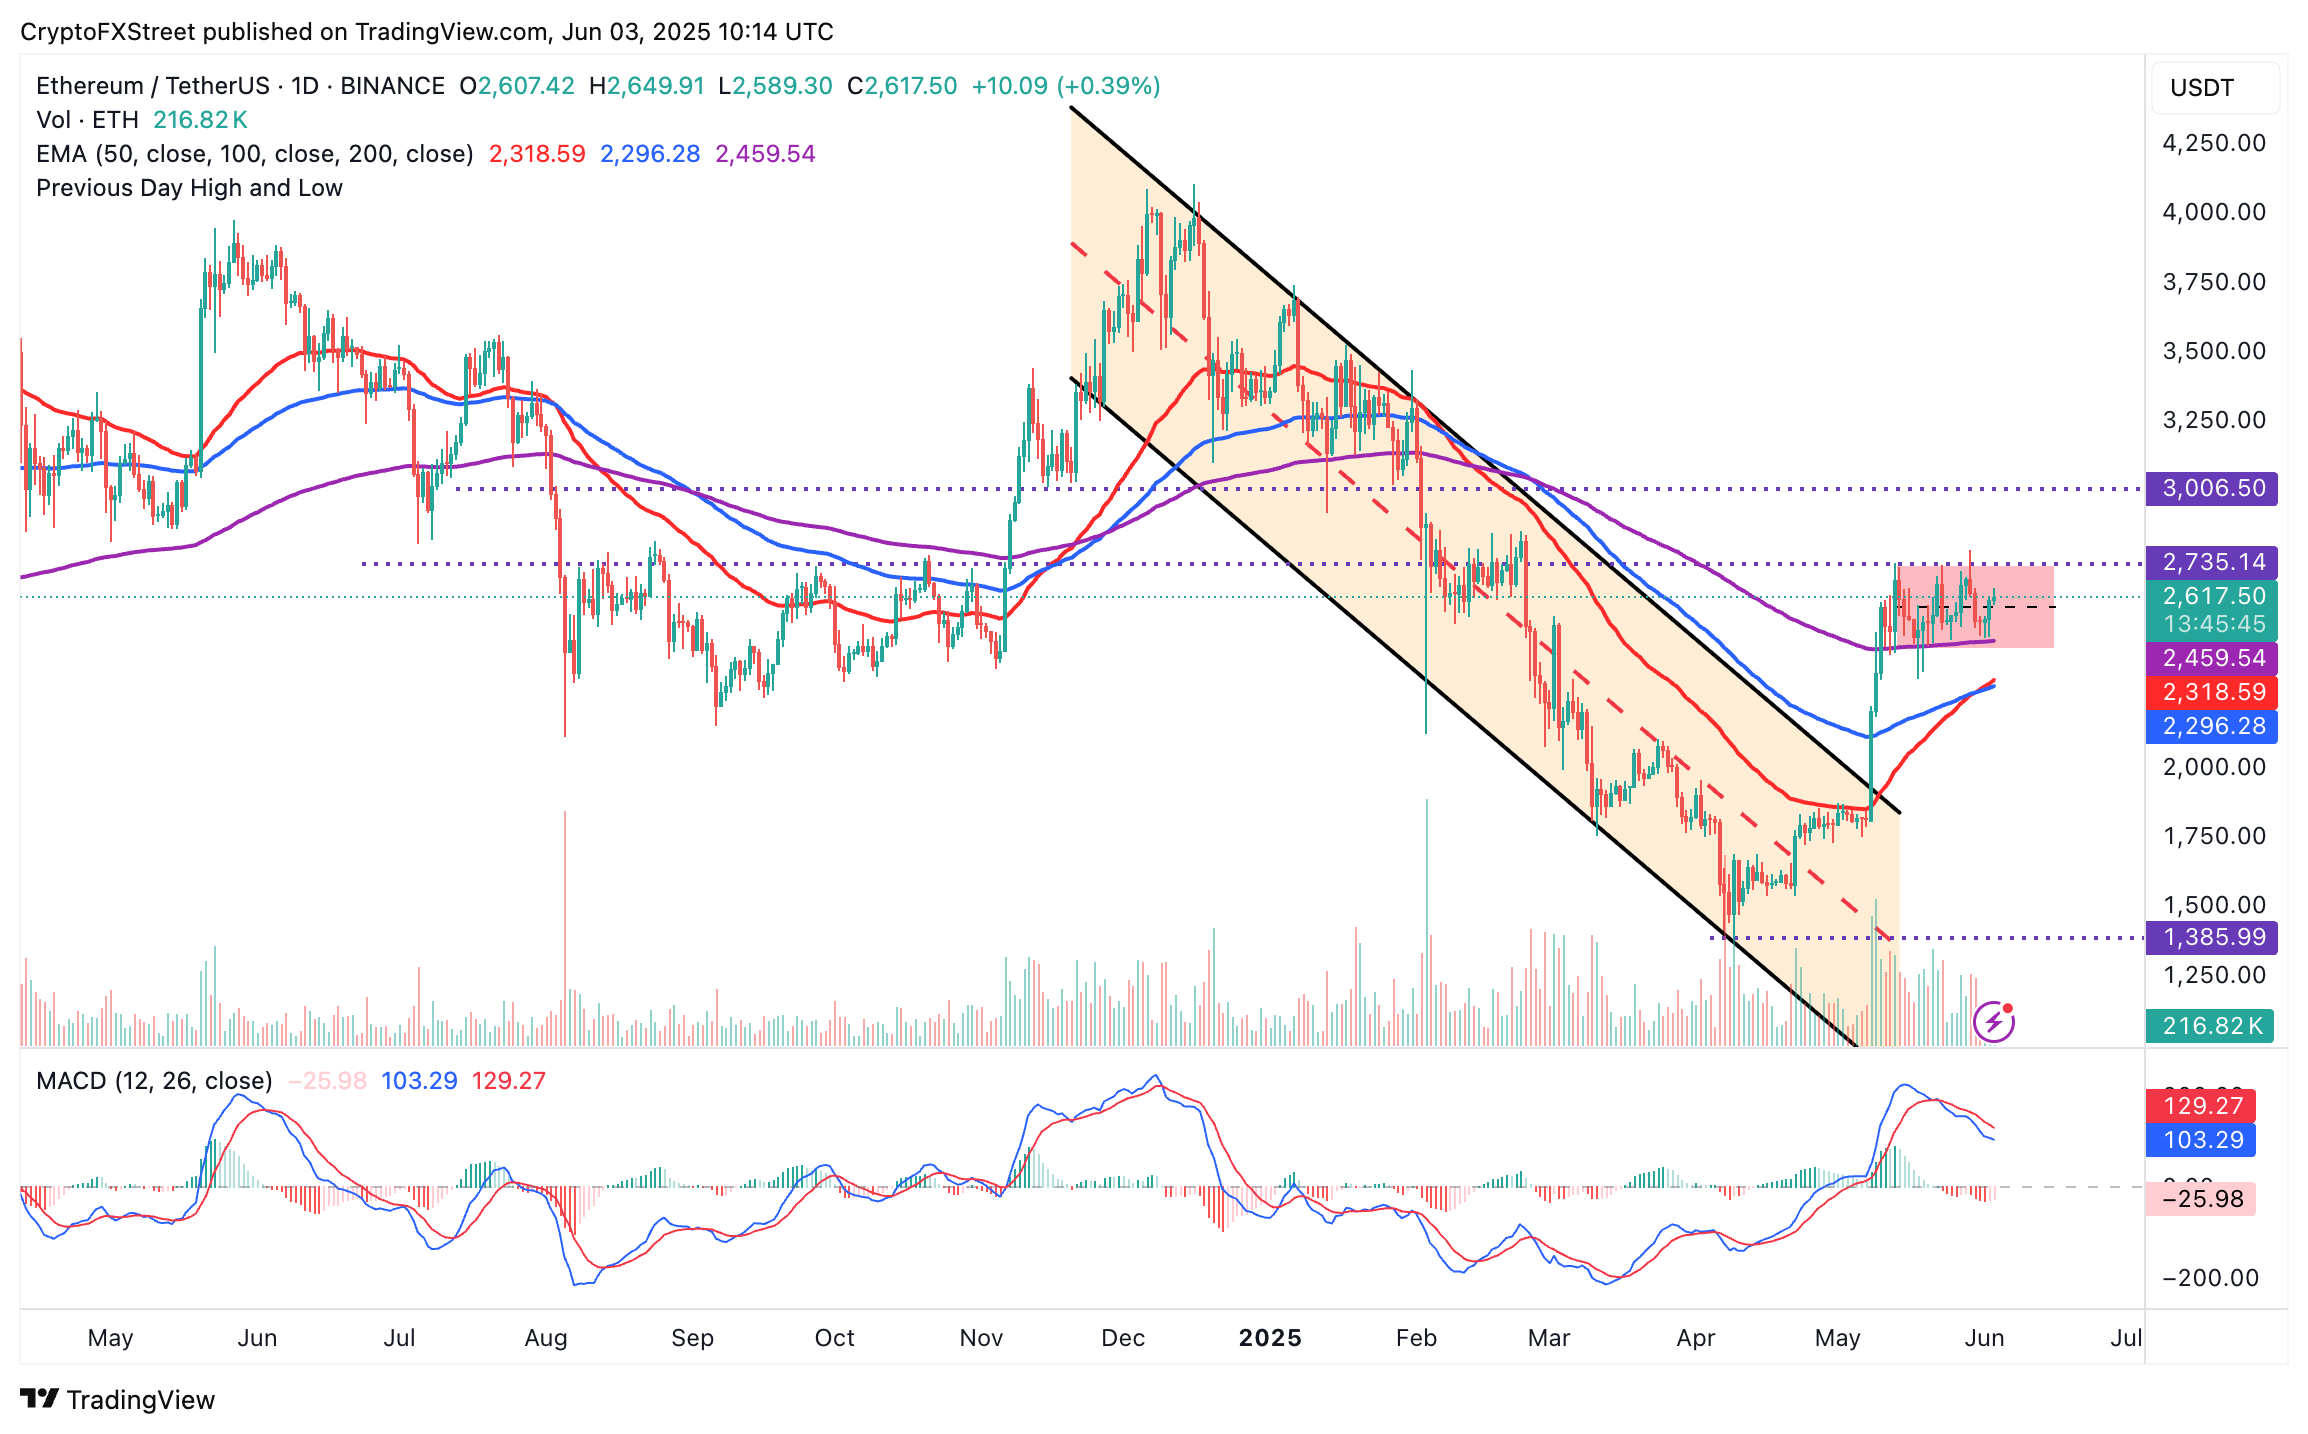
ETH/USD daily chart
The 50-day EMA recently crossed above the 100-day EMA, validating a golden cross. This bullish outlook, alongside consistent inflows into Ethereum-based products, suggests strong bullish momentum. However, the downward-sloping MACD indicator, which signals a sell, calls for caution among traders this week.
Cryptocurrency metrics FAQs
The developer or creator of each cryptocurrency decides on the total number of tokens that can be minted or issued. Only a certain number of these assets can be minted by mining, staking or other mechanisms. This is defined by the algorithm of the underlying blockchain technology. On the other hand, circulating supply can also be decreased via actions such as burning tokens, or mistakenly sending assets to addresses of other incompatible blockchains.
Market capitalization is the result of multiplying the circulating supply of a certain asset by the asset’s current market value.
Trading volume refers to the total number of tokens for a specific asset that has been transacted or exchanged between buyers and sellers within set trading hours, for example, 24 hours. It is used to gauge market sentiment, this metric combines all volumes on centralized exchanges and decentralized exchanges. Increasing trading volume often denotes the demand for a certain asset as more people are buying and selling the cryptocurrency.
Funding rates are a concept designed to encourage traders to take positions and ensure perpetual contract prices match spot markets. It defines a mechanism by exchanges to ensure that future prices and index prices periodic payments regularly converge. When the funding rate is positive, the price of the perpetual contract is higher than the mark price. This means traders who are bullish and have opened long positions pay traders who are in short positions. On the other hand, a negative funding rate means perpetual prices are below the mark price, and hence traders with short positions pay traders who have opened long positions.
Author

John Isige
FXStreet
John Isige is a seasoned cryptocurrency journalist and markets analyst committed to delivering high-quality, actionable insights tailored to traders, investors, and crypto enthusiasts. He enjoys deep dives into emerging Web3 tren


