Crypto Today: Bitcoin, Ethereum, XRP tilt toward breakout on risk-on sentiment
- Bitcoin breaks out above $116,000 as institutional demand returns.
- Ethereum holds above $4,300 as steady ETF inflows support the bullish outlook.
- XRP rebounds above the 100-day EMA support, increasing the chances of a breakout above $3.00.

Bitcoin (BTC) kicked off October on a strong note, with the price breaking above $116,000 on Wednesday. Despite a market-wide expectation that September is usually a bearish month for cryptocurrencies, BTC posted gains of 5.31%.
Altcoins, including Ethereum (ETH) and Ripple (XRP), also edge higher at the time of writing. The next few weeks and months will be closely monitored amid general expectations that the fourth quarter is the most bullish one for crypto.
Data spotlight: Bitcoin rises as Metaplanet increases exposure
Institutions operating Bitcoin treasuries continue to seek risk exposure despite fluctuations in the Bitcoin price. Japan’s Metaplanet purchased an additional 5,268 BTC – worth around $603.7 million – last week, bringing its current holdings to 30,823 BTC valued at $3.53 billion at an average buying price of $107,912, according to LookOnChain.
On the spot Exchange Traded Funds (ETF) front, institutional investors are doubling their efforts as the price recovers following the correction near $107,000 in September.
According to SoSoValue data, BTC ETFs in the United States experienced approximately $430 million in inflows on Tuesday, extending the bullish streak for two consecutive days. None of the 12 ETF products saw outflows, with BlackRock’s IBIT leading with $199 million, followed by Ark Invest’s ARKB with $106 million and Fidelity’s FBTC with $55 million.
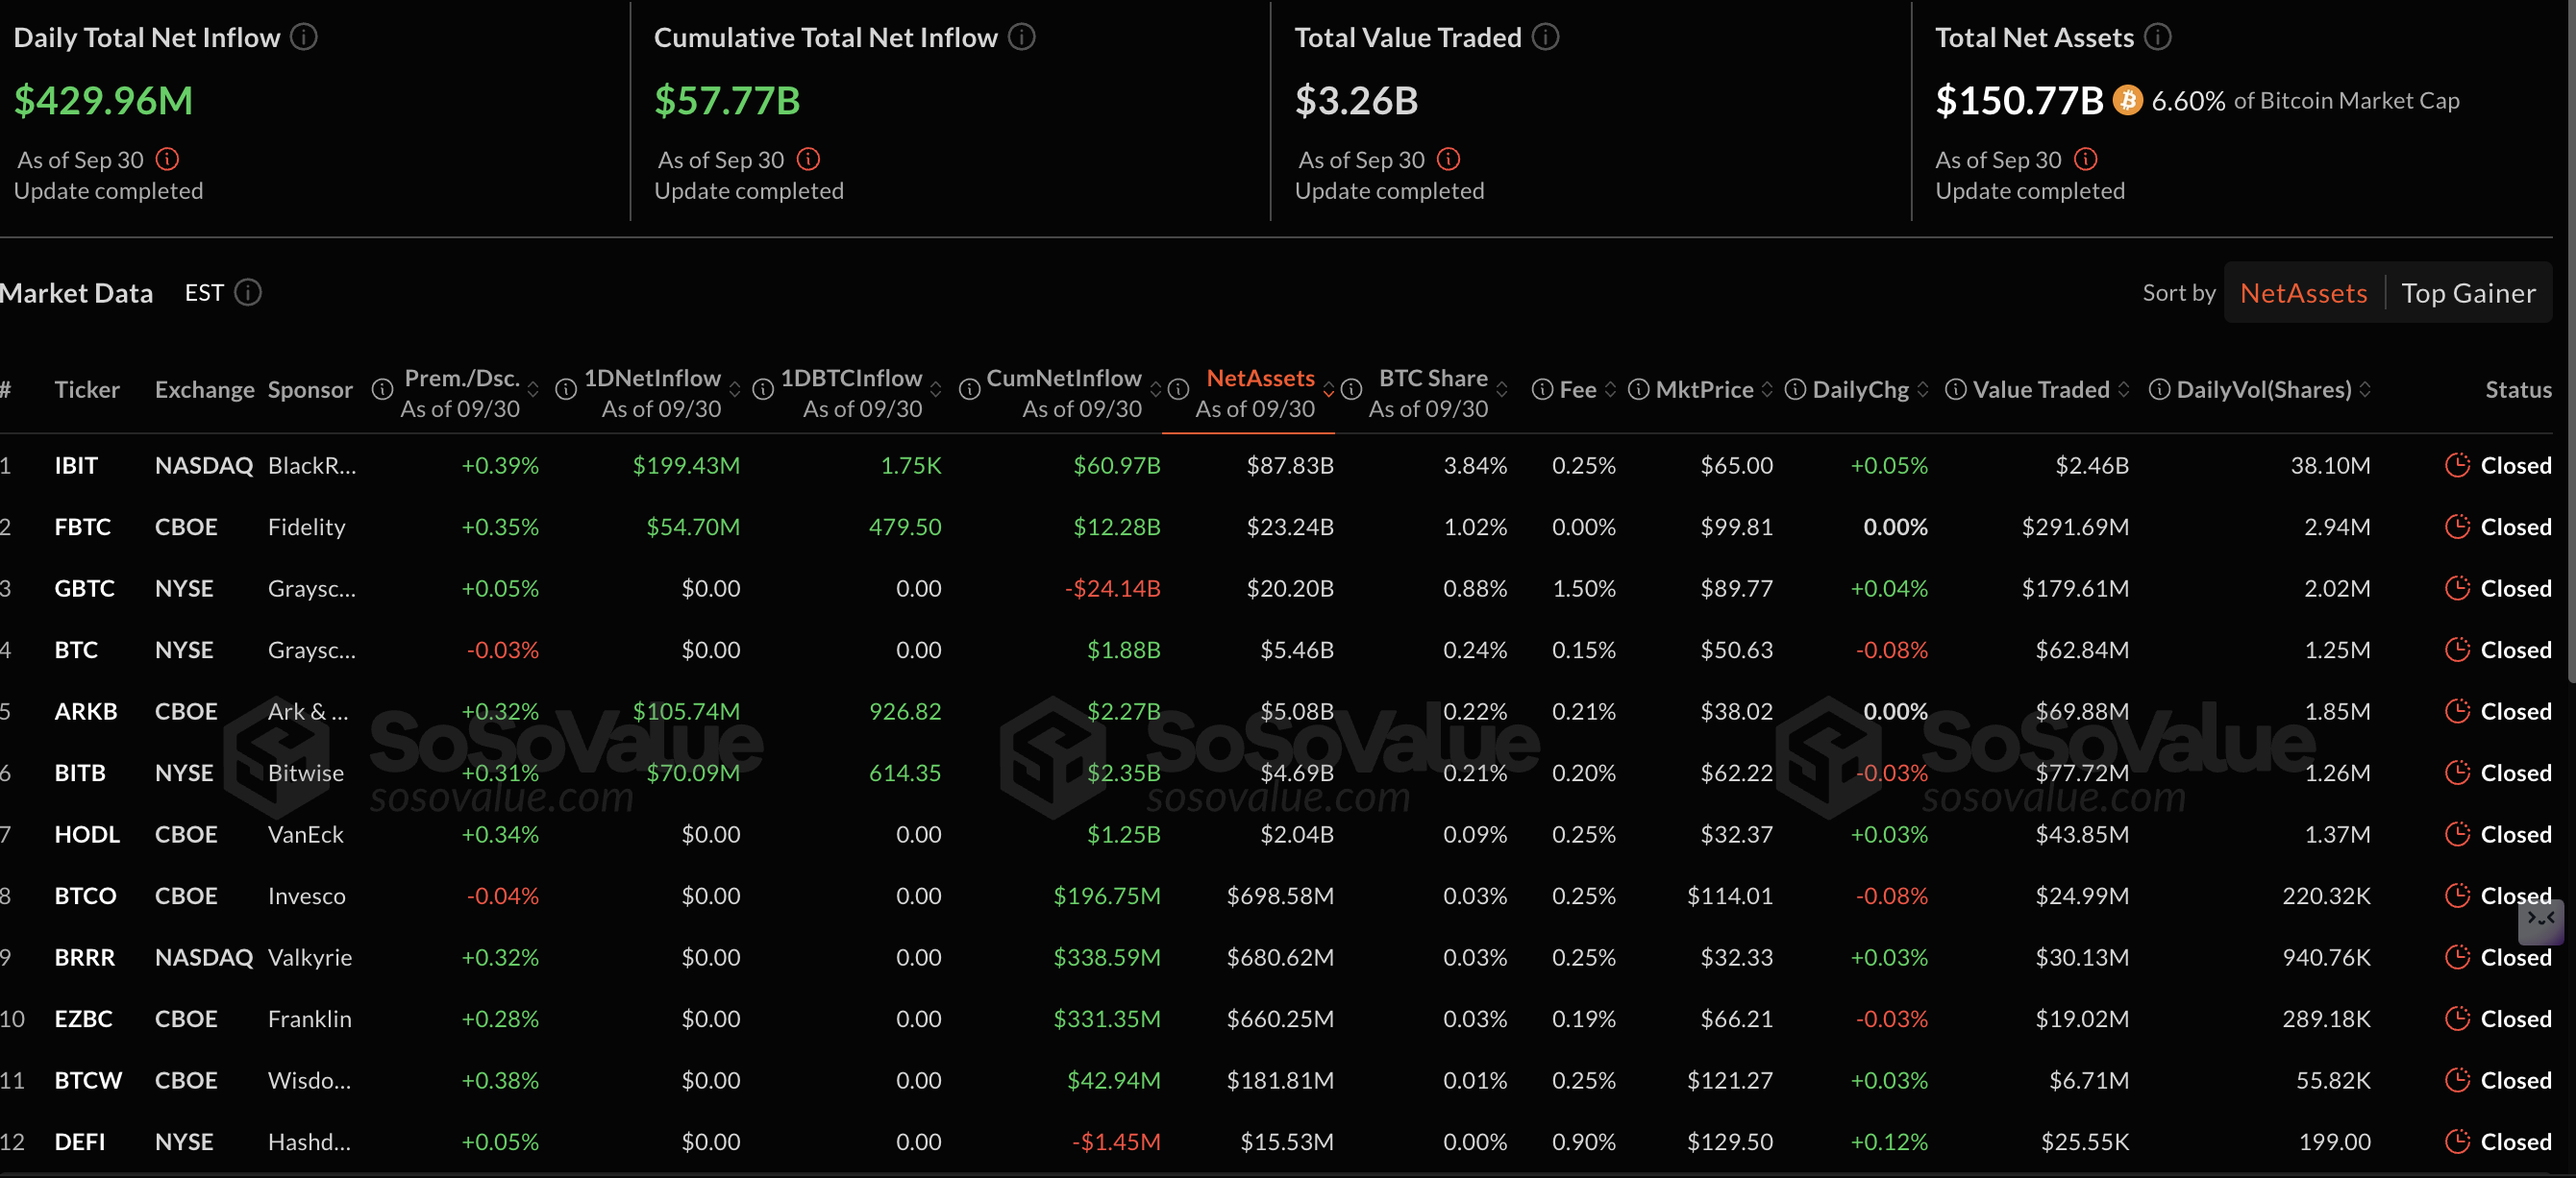
Bitcoin ETF stats | Source: SoSoValue
Institutional interest in Ethereum is also gaining momentum, considering steady inflows of $547 million on Monday and $127 million on Tuesday. Apart from BlackRock’s ETHA, the rest of the nine ETH ETFs in the US did not experience inflows or outflows on Tuesday.
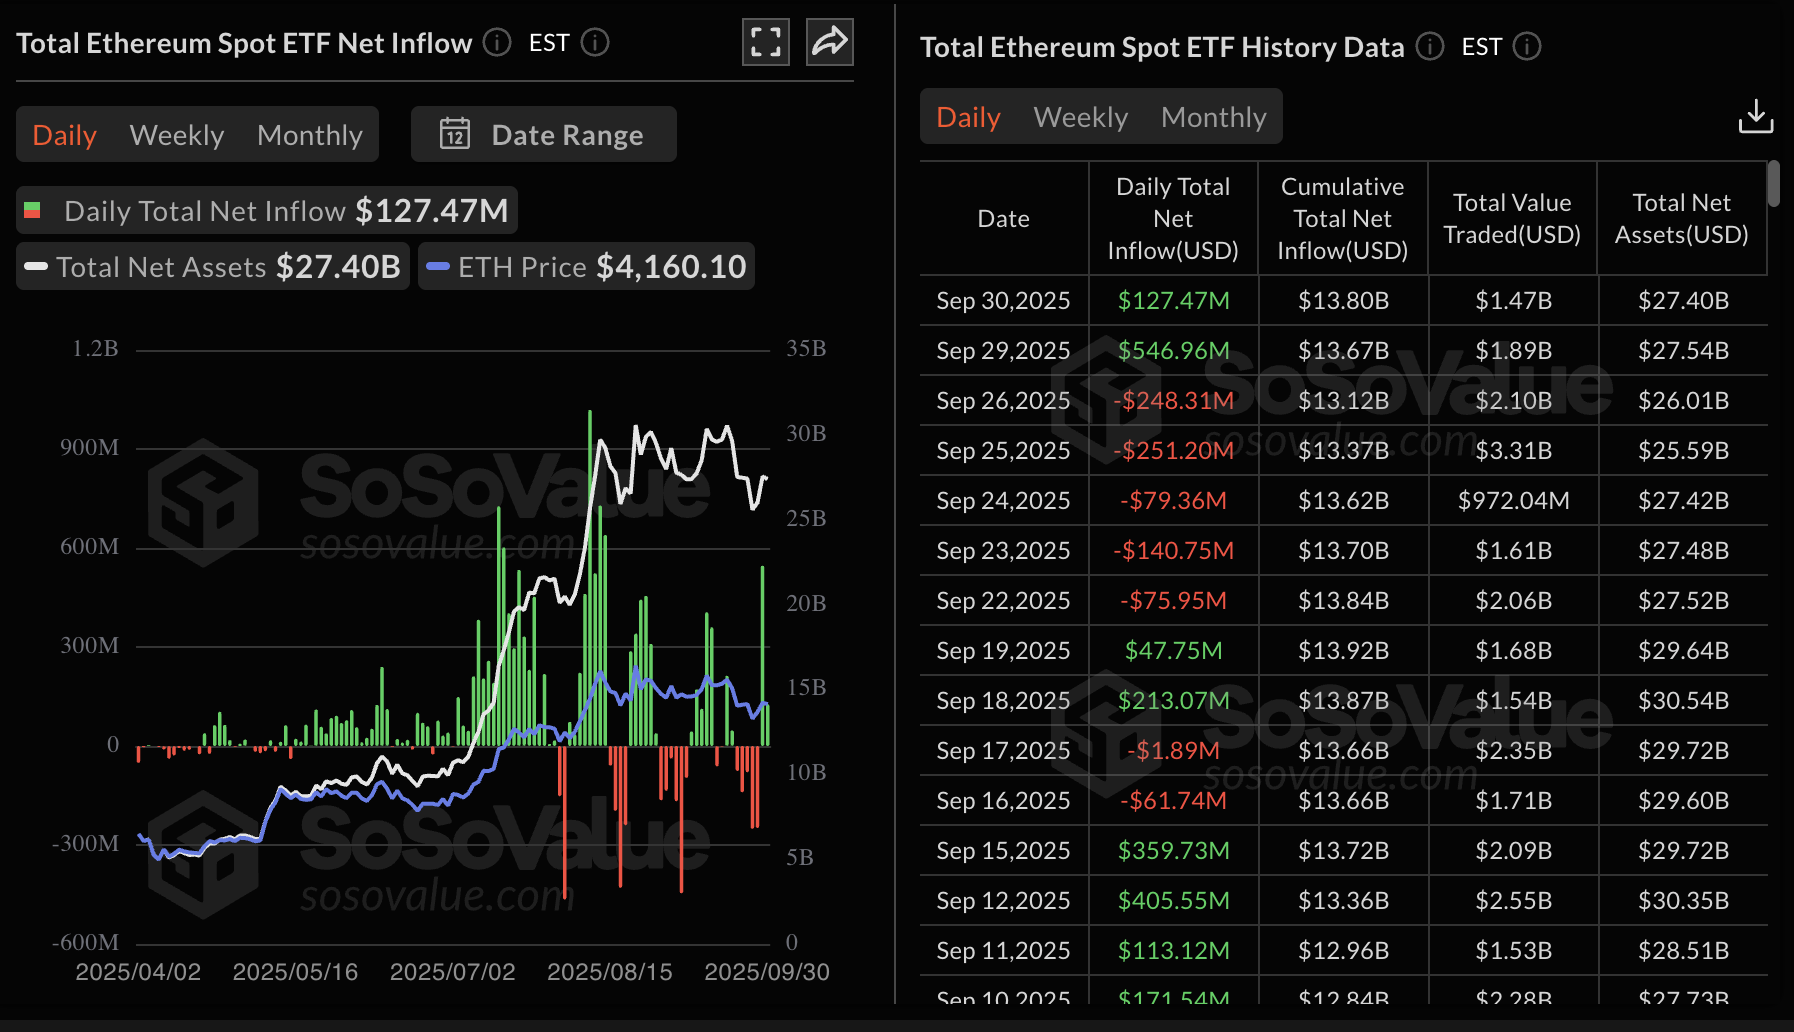
Ethereum ETF stats | Source: SoSoValue
Chart of the day: Bitcoin renews bullish momentum
Bitcoin edges higher above the $116,000 level at the time of writing on Monday. The position of key moving averages, including the 200-day Exponential Moving Average (EMA) at $106,515, the 100-day EMA at $111,929 and the 50-day EMA at $113,471, supports the short-term bullish outlook, targeting a breakout toward the psychological level of $120,000.
The Relative Strength Index (RSI), rising at 58 on the daily chart, supports the bullish momentum.
Traders could increase risk exposure if the Moving Average Convergence Divergence (MACD) indicator sustains a buy signal triggered earlier in the day. The blue MACD line crossover above the red signal line suggests that bullish momentum is building.
Key areas of interest for traders are the 50-day EMA at $113,471 and the 100-day EMA at $111,929, both of which could serve as tentative support levels if Bitcoin retreats.
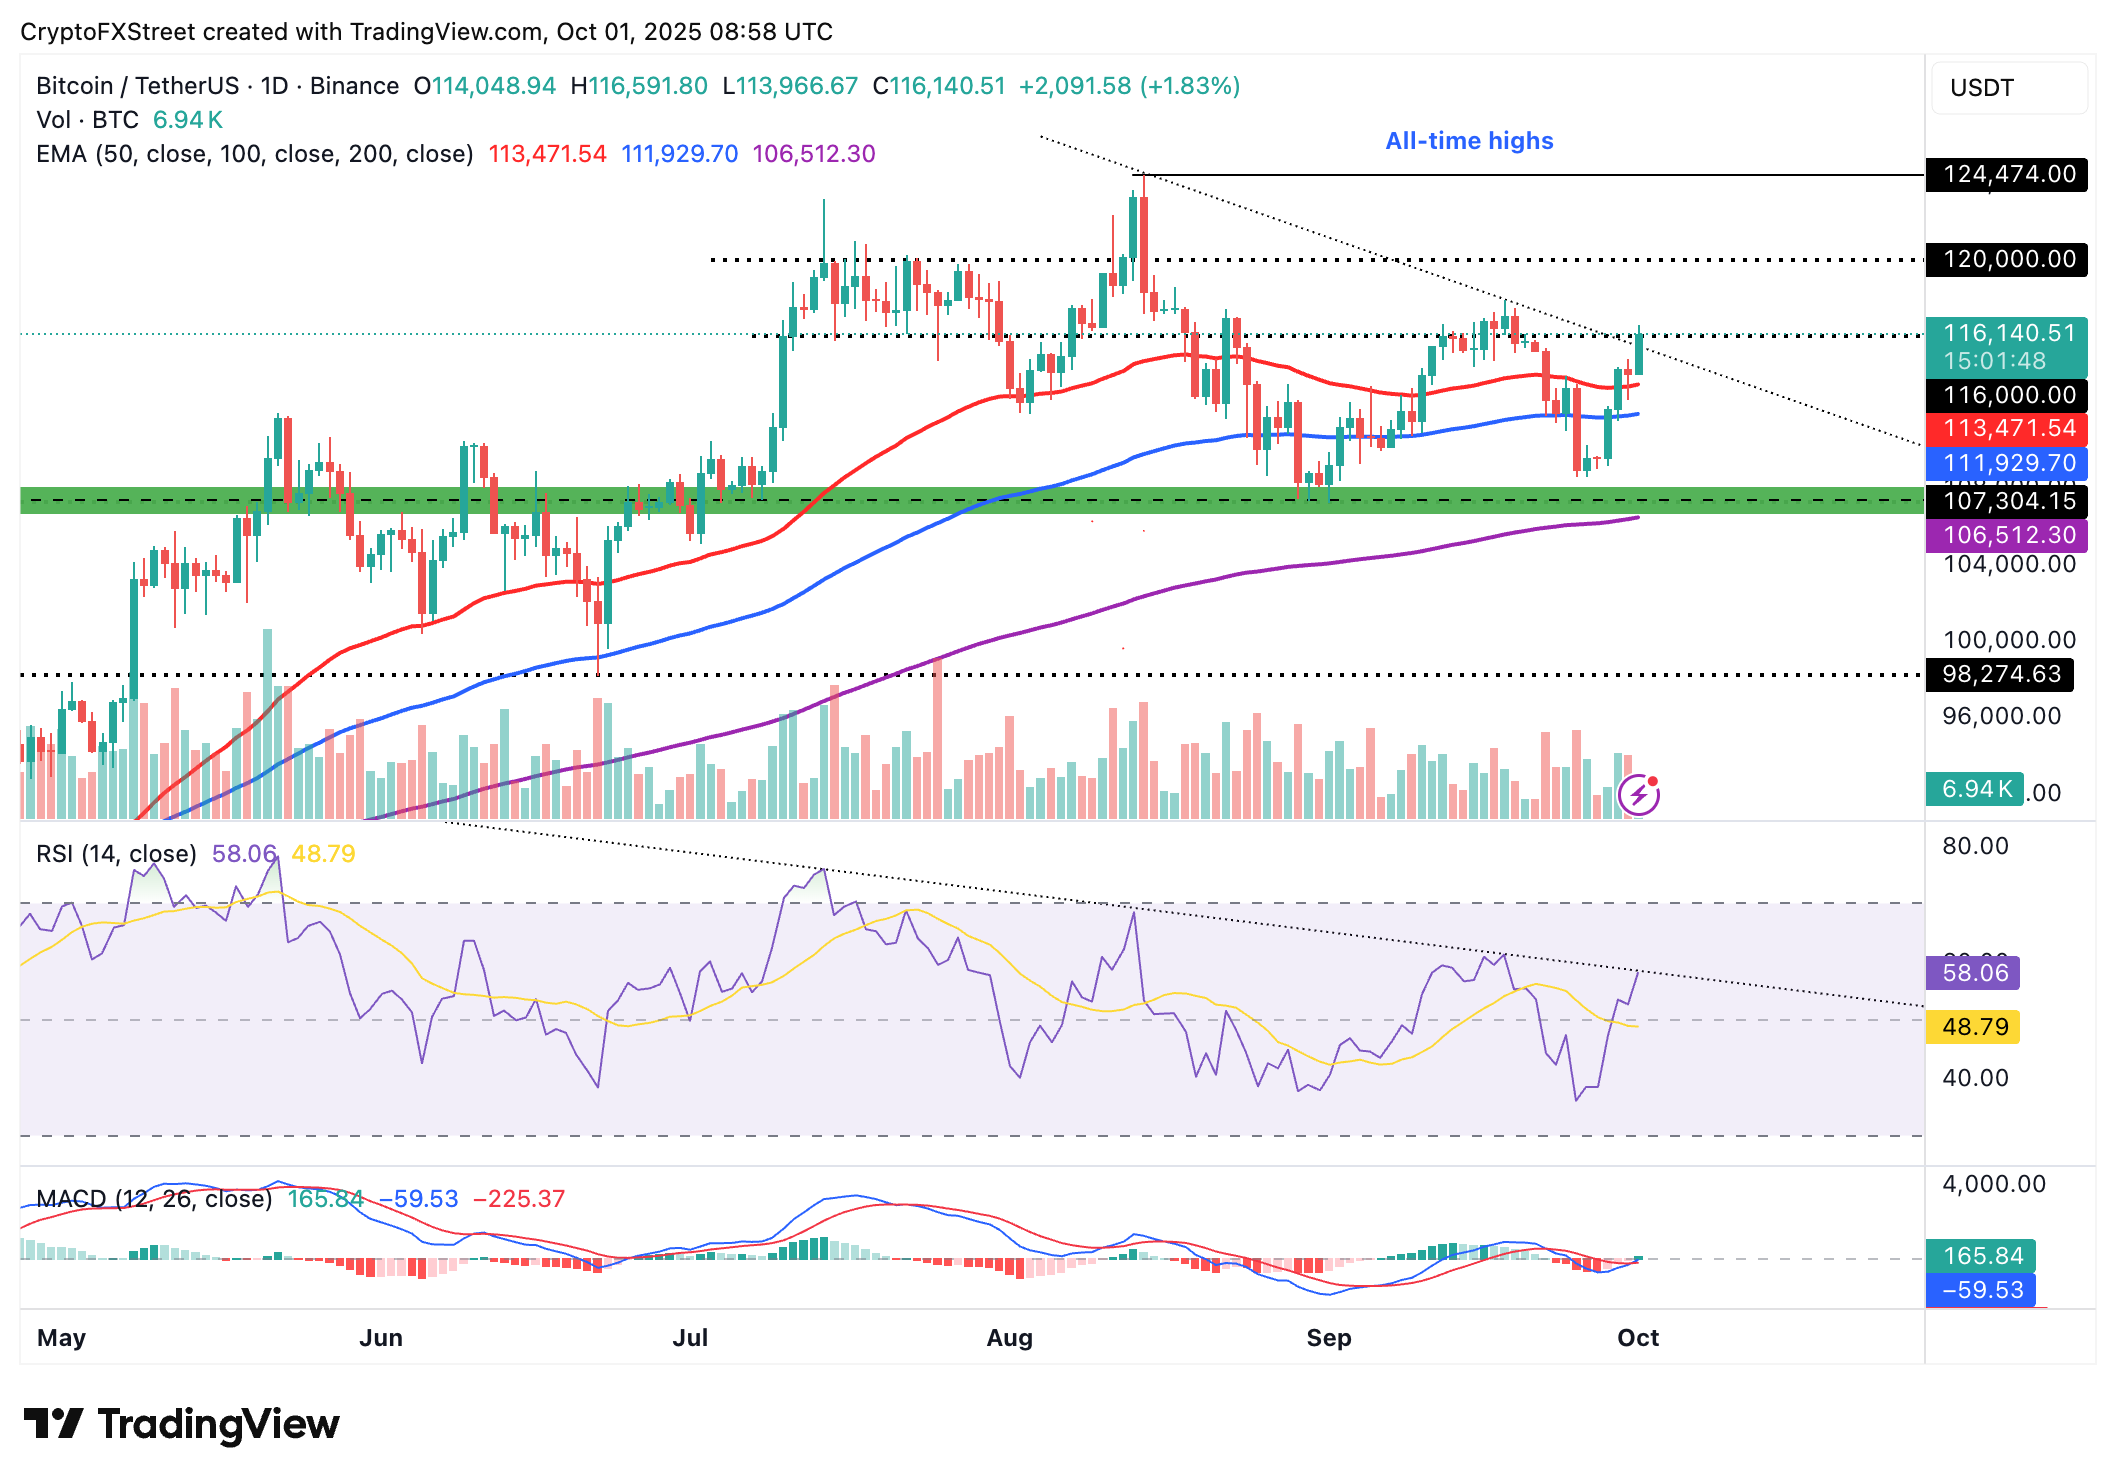
BTC/USDT daily chart
Altcoins update: Ethereum, XRP extend recovery
Ethereum trades around $4,300 as bulls drive prices higher in the broader cryptocurrency market. Its short-term bullish outlook has the backing of the 50-day EMA at $4,214, the 100-day EMA at $3,880 and the 200-day EMA at $3,433. The RSI bullish crossover above the signal line indicates that bullish momentum is growing.
Retail demand for Ethereum could also improve if the MACD indicator confirms a buy signal on the daily chart in upcoming sessions. This signal will occur when the blue line crosses and settles above the red signal line.
Key milestones for Ethereum include a break above the round-number resistance at $4,500 and the general downward trend from its record high of $4,956.
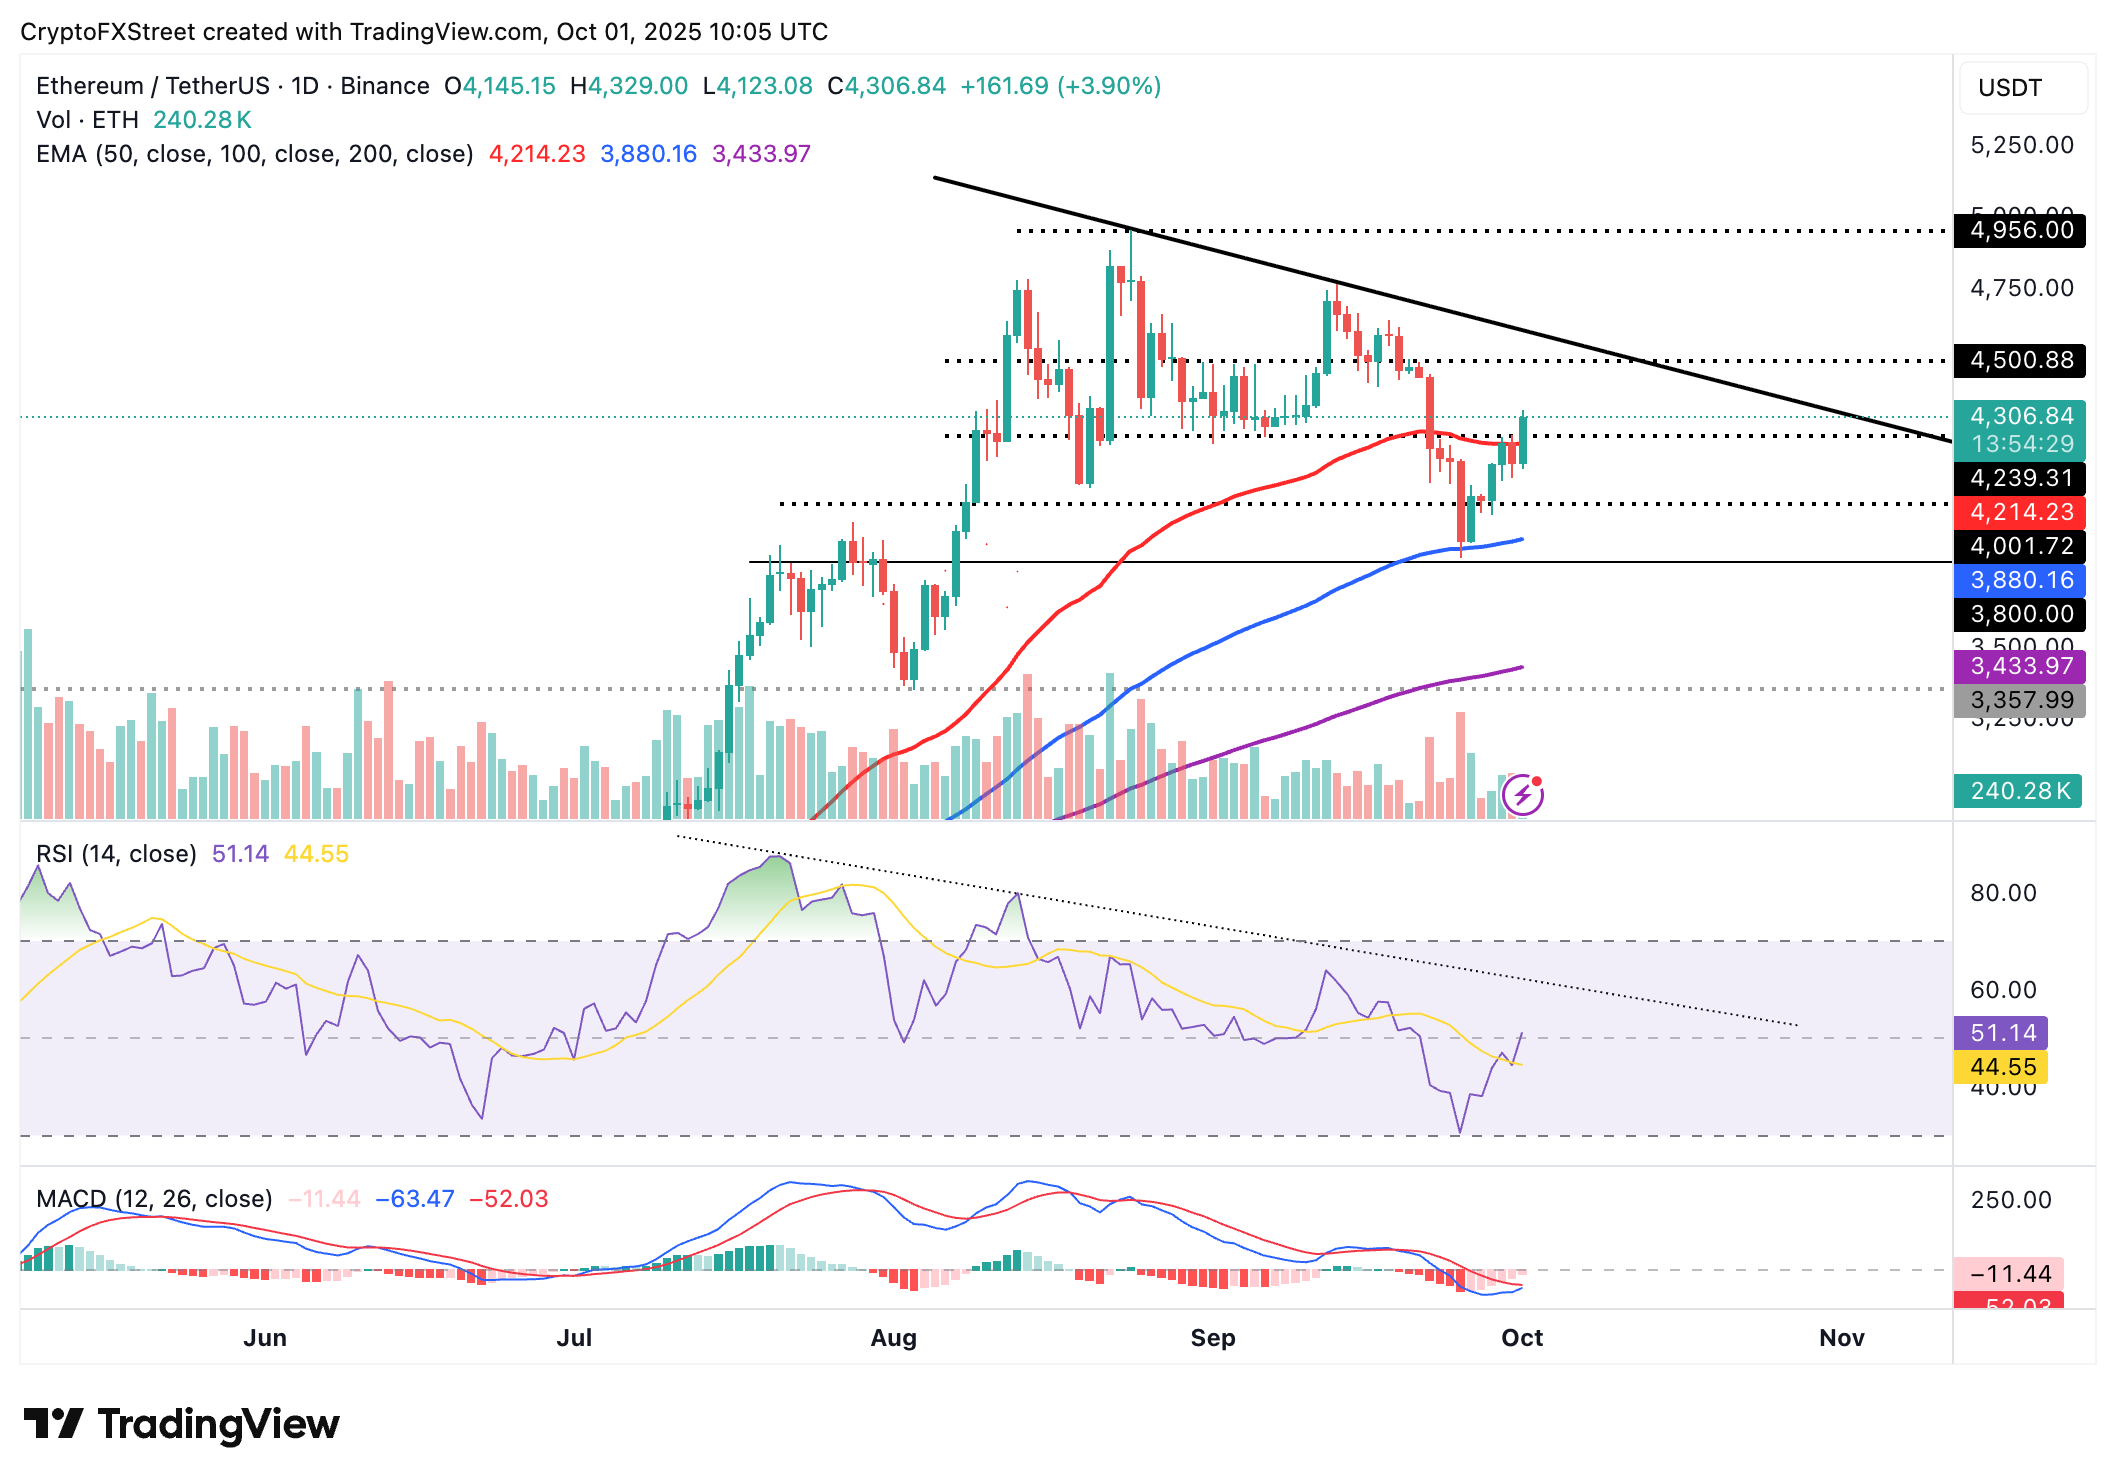
ETH/USDT daily chart
As for XRP, an uptrend is underway targeting a breakout above the pivotal $3.00 level. Meanwhile, the 100-day EMA at $2.83 and the 200-day EMA at $2.61 underscore positive market sentiment, which is also well-positioned to provide support if a strong correction ensues.
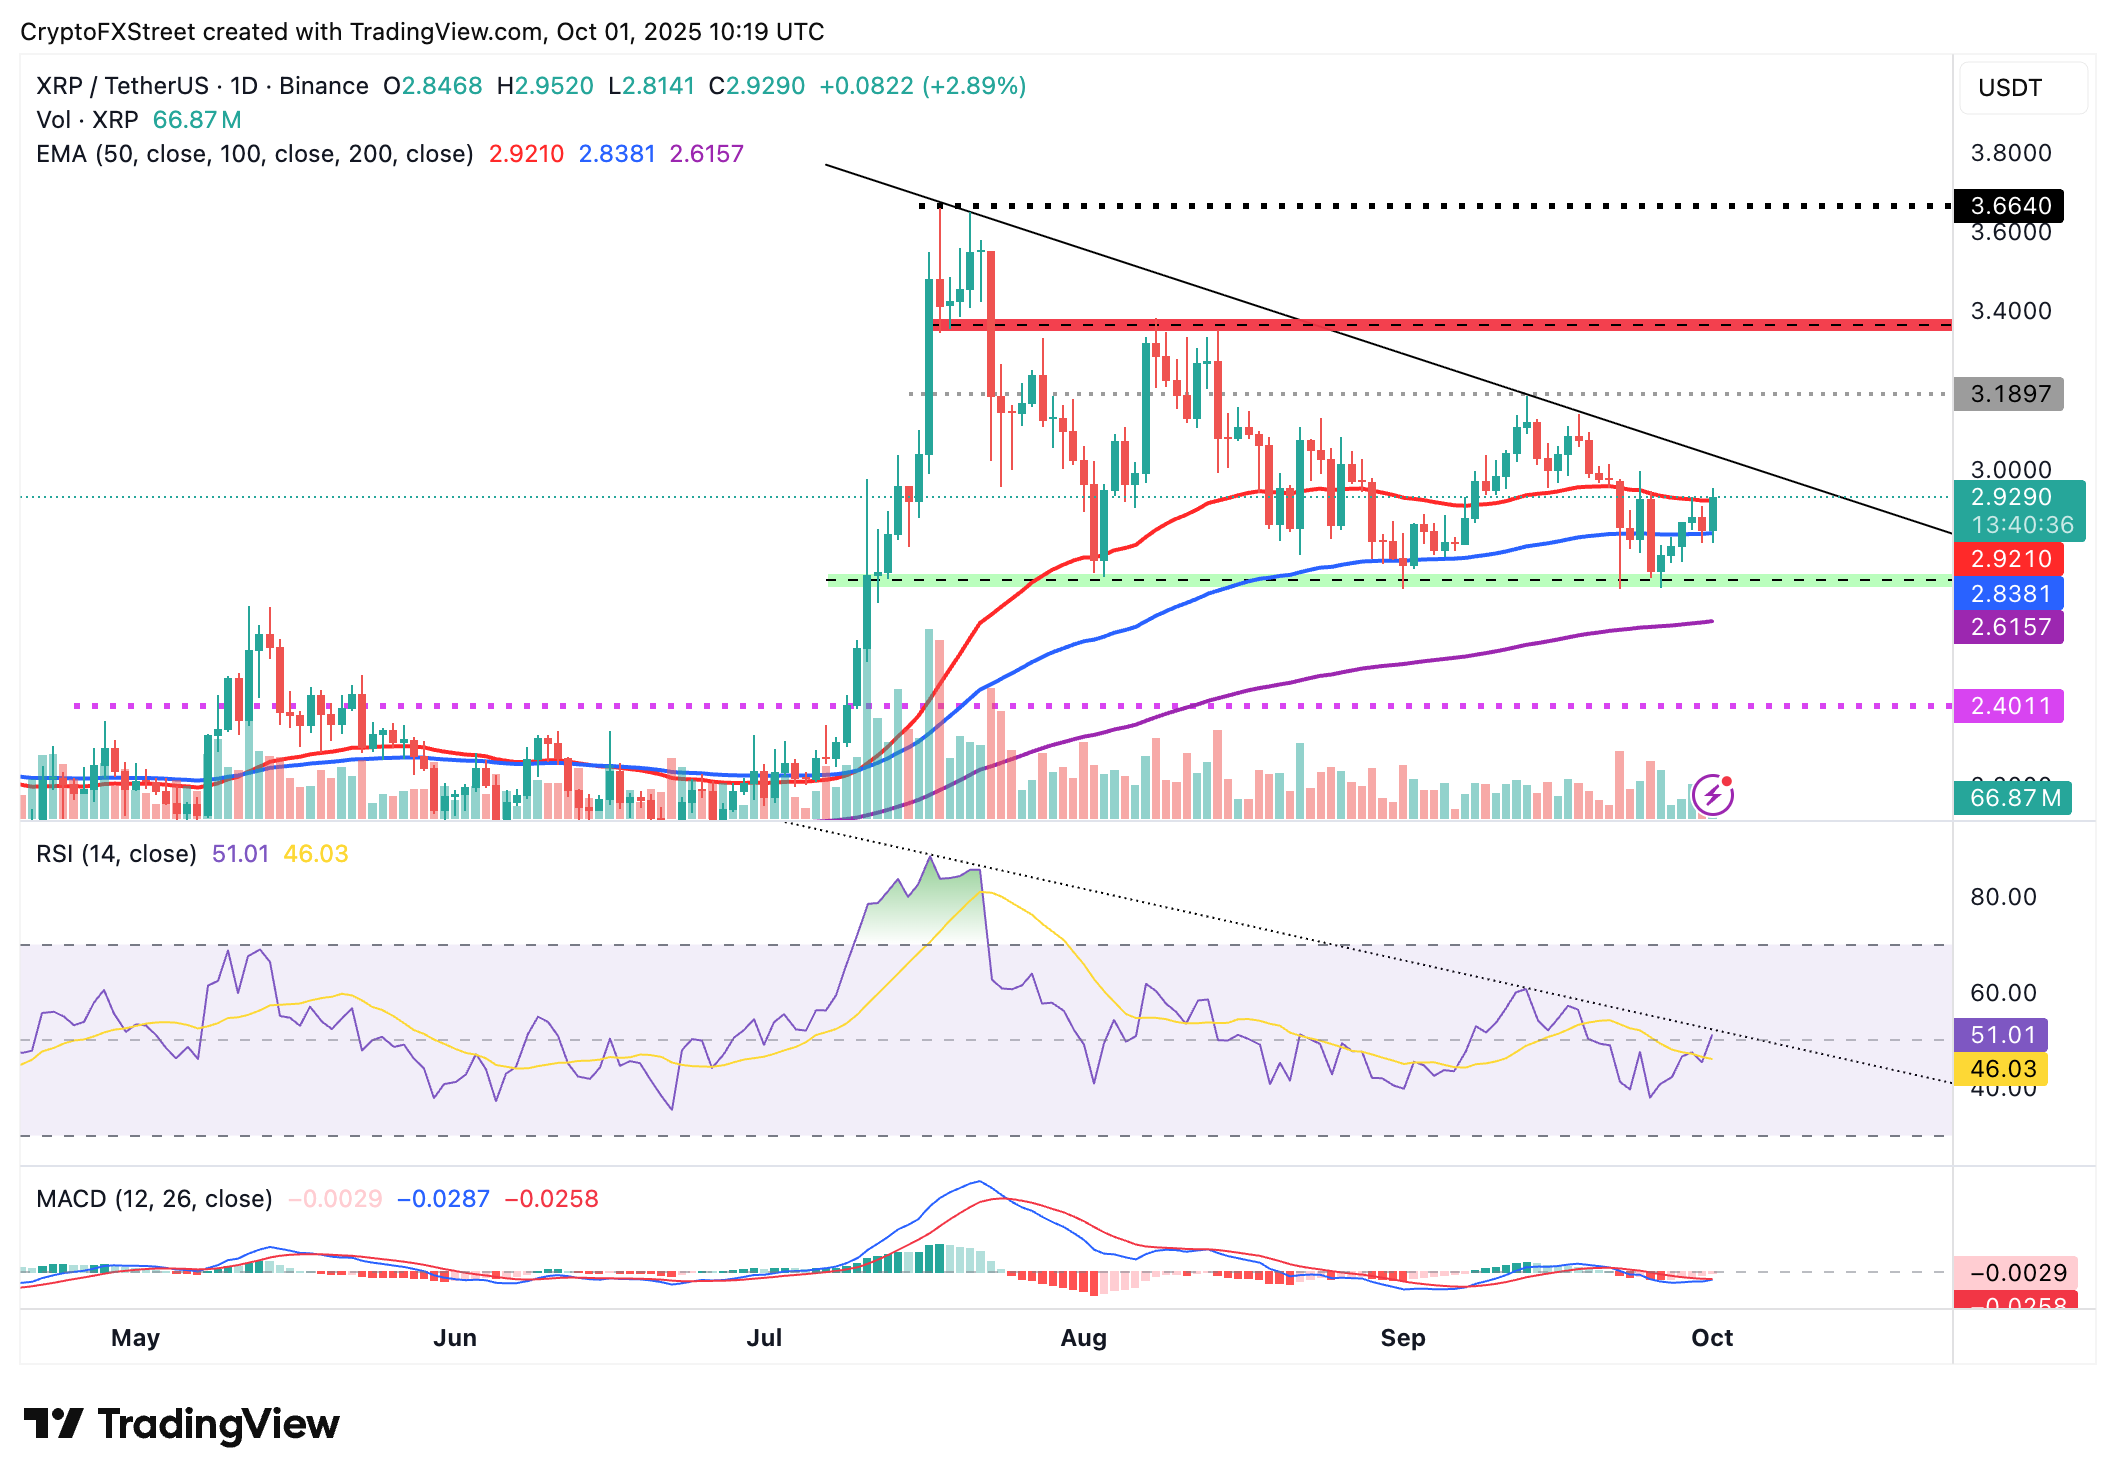
XRP/USDT daily chart
Key technical indicators supporting the bullish outlook include the RSI, which is rising to 51, and the MACD, which could confirm a buy signal before the end of the day if bulls hold onto intraday gains.
Key areas of interest for traders are the descending trendline in place since mid-July, when XRP reached a new record high of $3.66, and the next supply zone at $3.18, which was tested on September 13 as resistance.
Cryptocurrency prices FAQs
Token launches influence demand and adoption among market participants. Listings on crypto exchanges deepen the liquidity for an asset and add new participants to an asset’s network. This is typically bullish for a digital asset.
A hack is an event in which an attacker captures a large volume of the asset from a DeFi bridge or hot wallet of an exchange or any other crypto platform via exploits, bugs or other methods. The exploiter then transfers these tokens out of the exchange platforms to ultimately sell or swap the assets for other cryptocurrencies or stablecoins. Such events often involve an en masse panic triggering a sell-off in the affected assets.
Macroeconomic events like the US Federal Reserve’s decision on interest rates influence crypto assets mainly through the direct impact they have on the US Dollar. An increase in interest rate typically negatively influences Bitcoin and altcoin prices, and vice versa. If the US Dollar index declines, risk assets and associated leverage for trading gets cheaper, in turn driving crypto prices higher.
Halvings are typically considered bullish events as they slash the block reward in half for miners, constricting the supply of the asset. At consistent demand if the supply reduces, the asset’s price climbs.
Author

John Isige
FXStreet
John Isige is a seasoned cryptocurrency journalist and markets analyst committed to delivering high-quality, actionable insights tailored to traders, investors, and crypto enthusiasts. He enjoys deep dives into emerging Web3 tren


