Crypto Today: Bitcoin, Ethereum, XRP show weakness, but rising Open Interest depicts bullish speculation
- Bitcoin extends its decline toward $118,000, a key short-term support level, as BTC spot ETFs mark second consecutive day of outflows.
- Ethereum claws back gains, sliding below $3,700 on Wednesday, reflecting potential profit-taking pressure.
- XRP’s RSI unveils overheated market conditions as the price drops below $3.50.

Cryptocurrencies are showing signs of weakness overall, with leading assets, including Bitcoin (BTC), Ethereum (ETH), and Ripple (XRP), edging lower at the time of writing on Wednesday. A 3.5% decline in the total market capitalization to $3.9 trillion over the past 24 hours underscores the overhead pressure possibly due to profit-taking.
Bitcoin price is currently trading at around $118,290, following a rejection from an intraday high of $120,090. The selling pressure is also impacting altcoins, with Ethereum price falling by more than 2% on the day to trade at $3,652. Similarly, the cross-border money remittance token, XRP, is down over 3%, exchanging hands at $3.44.
Market overview: Bitcoin ETF outflows persist as Open Interest rises
Bitcoin spot Exchange Traded Funds (ETFs) started the week on the back foot, recording outflows of approximately $131 million and $68 million on Monday and Tuesday, respectively. According to SoSoValue, the cumulative total net inflow averages nearly $55 billion, with net assets at $155 billion.
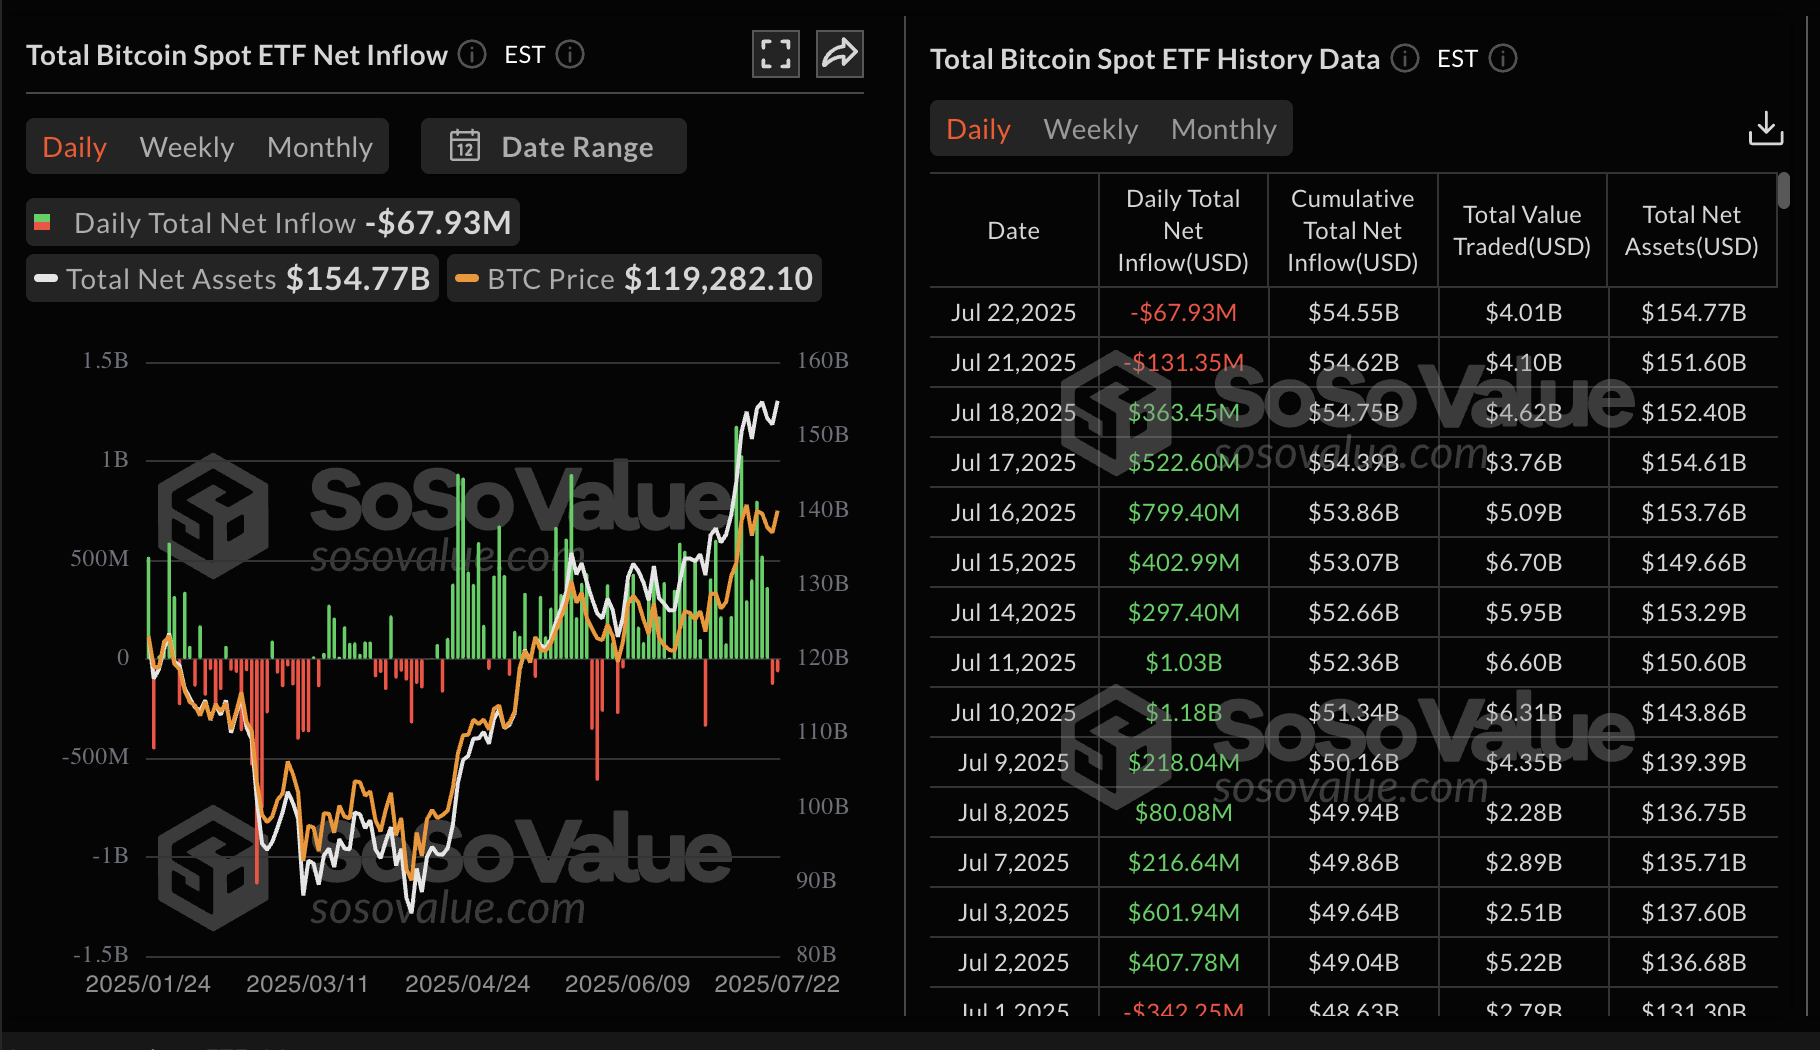
Bitcoin spot ETF data | Source: SoSoValue
The picture is distinctively different for Ethereum, whose spot ETFs continue to experience net inflows. Following a capital inflow of $296 million on Monday, the crypto investment products purchased directly on stock exchanges recorded approximately a $534 million inflow on Tuesday.
Ethereum currently boasts $8.32 billion in cumulative net inflows with net assets averaging $19.85 million.
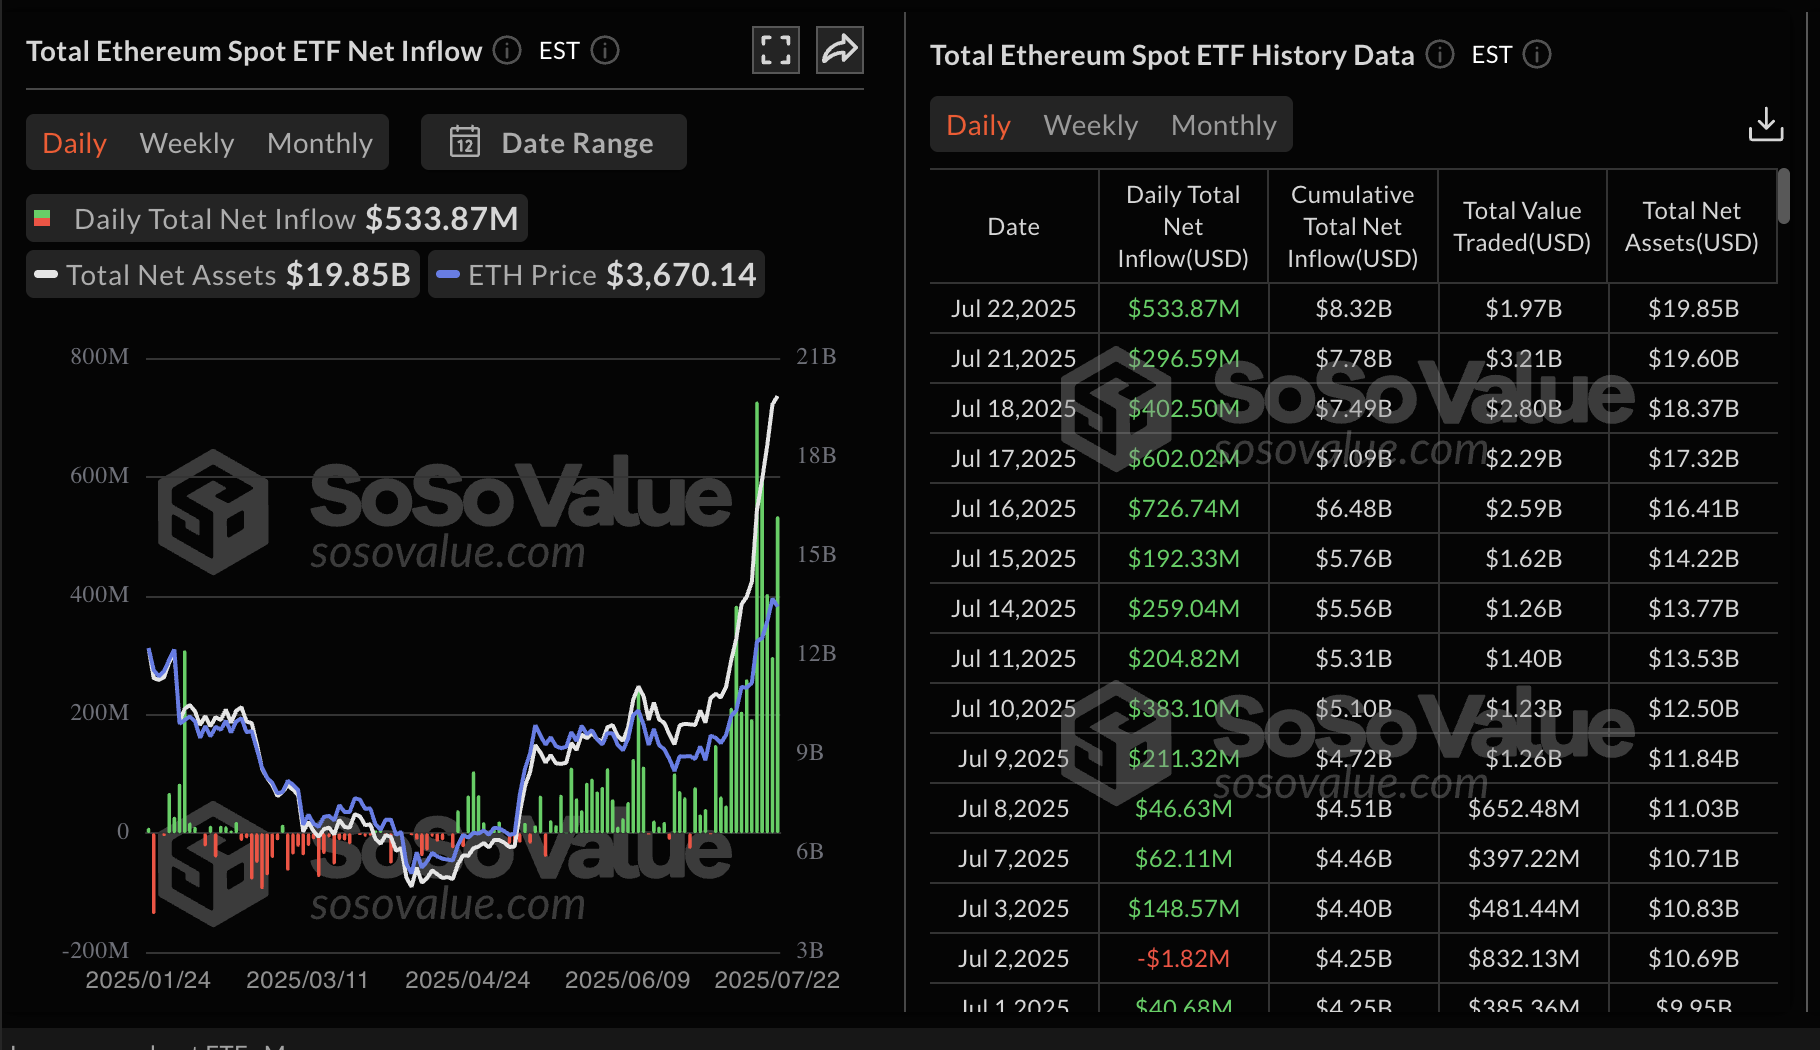
Ethereum spot ETF data | Source: SoSoValue
As for the derivatives market, Bitcoin futures Open Interest (OI) remains elevated at $86.82 billion, 90% above the lowest level in March at $45.72 billion. As Open Interest surges, it reflects growing investor confidence in the future of Bitcoin, hence the increase in bets for higher price levels.
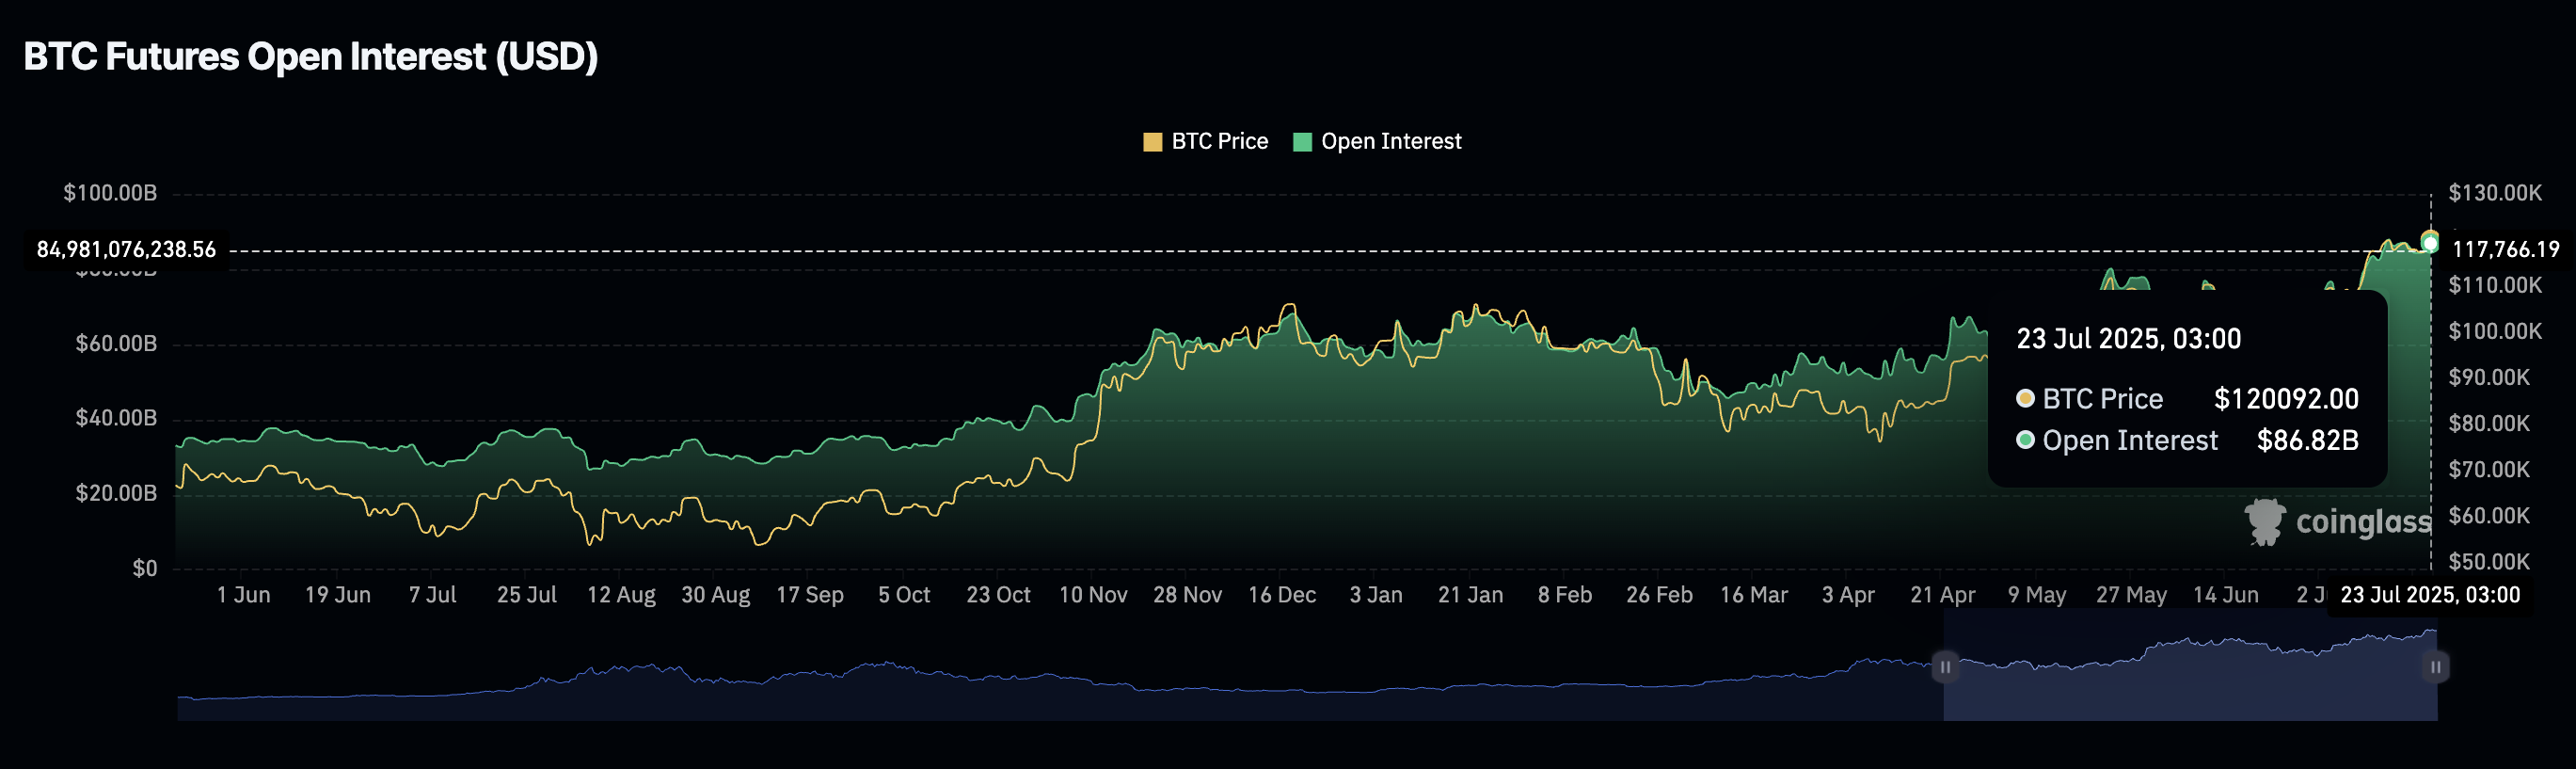
Bitcoin Futures Open Interest | Source: CoinGlass
Interest in Ethereum remains relatively high, averaging $55.89 billion on Wednesday. Open Interest refers to the value of all the futures and options contracts that have not been settled or closed. If volume increases in tandem, the outcome is often heightened market activity, which helps to support price increases.
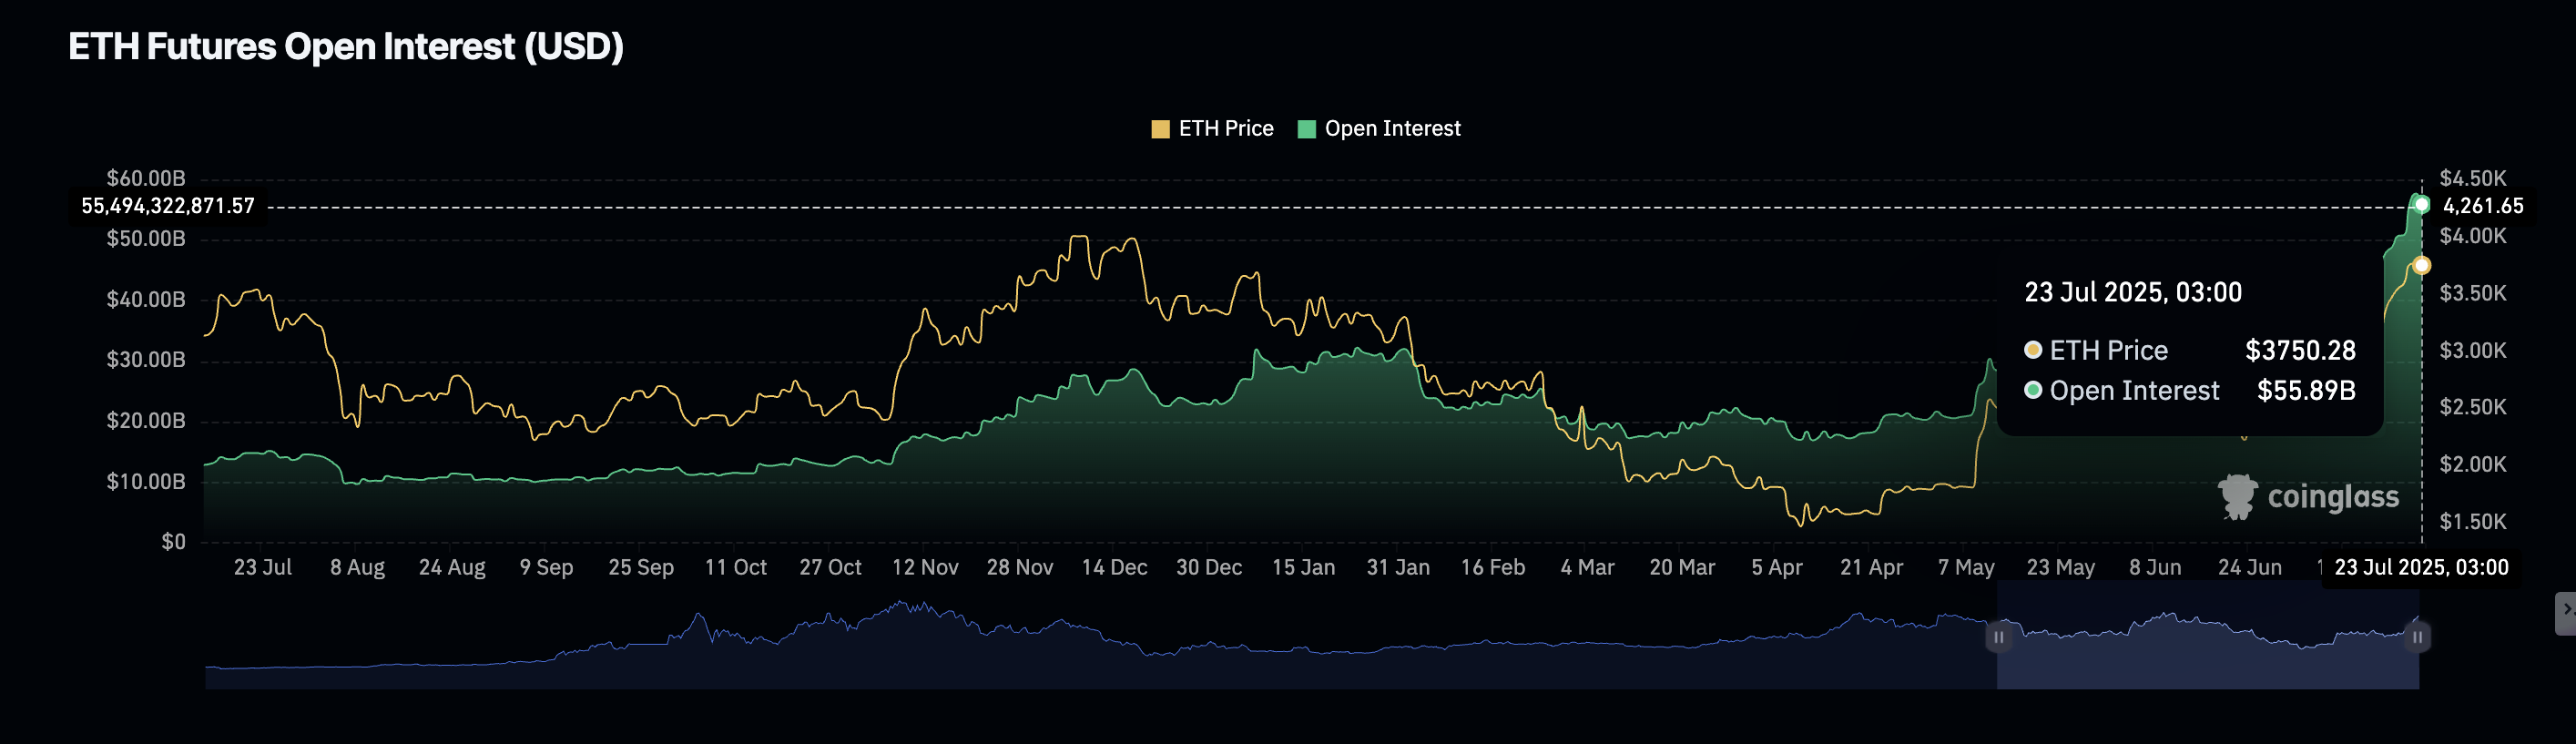
Ethereum Futures Open Interest | Source: CoinGlass
The same bullish outlook is reflected in the XRP derivatives market, where the futures OI has surged to new record highs, reaching $10.79 billion at the time of writing. XRP price hit a new all-time high of $3.66 on Friday before correcting to $3.44 at the time of writing. The decline could be a sweep through liquidity before the next attempt at breaking out to a new record high.
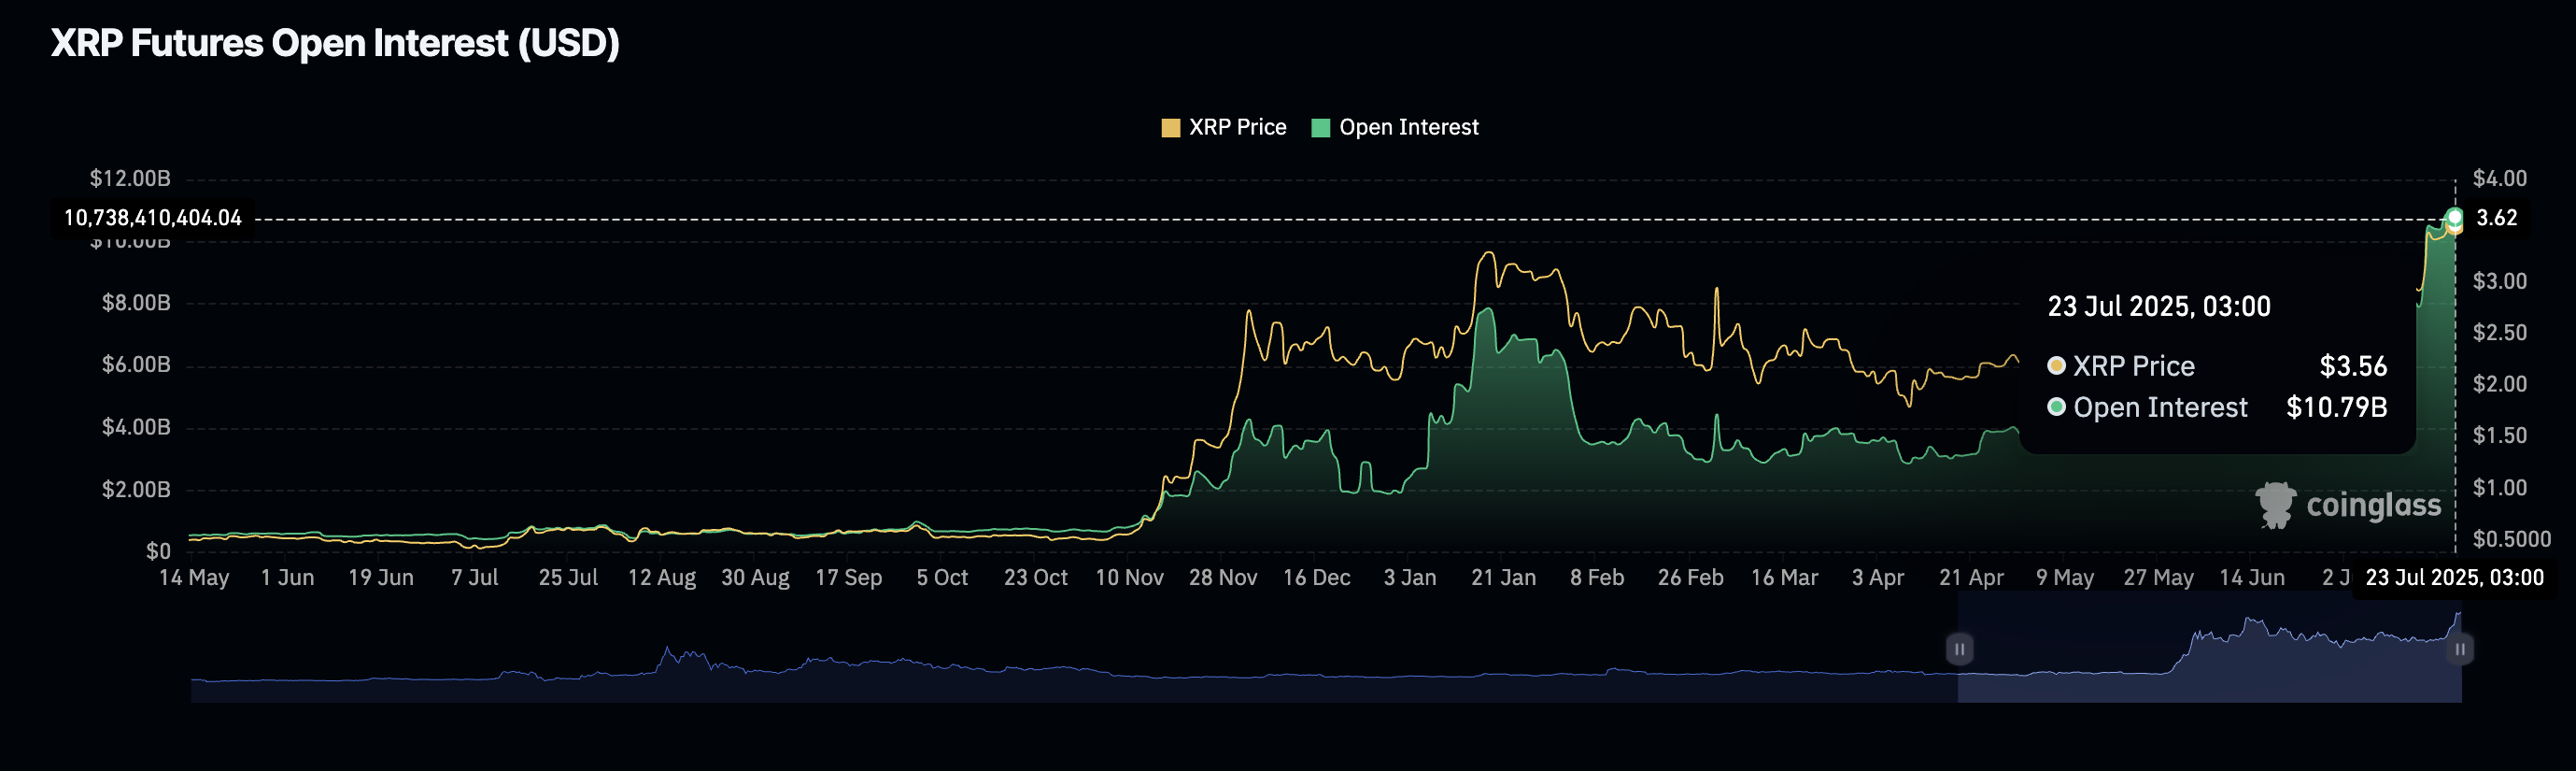
XRP Futures Open Interest | Source: CoinGlass
Chart of the Day: Bitcoin offers bearish signals
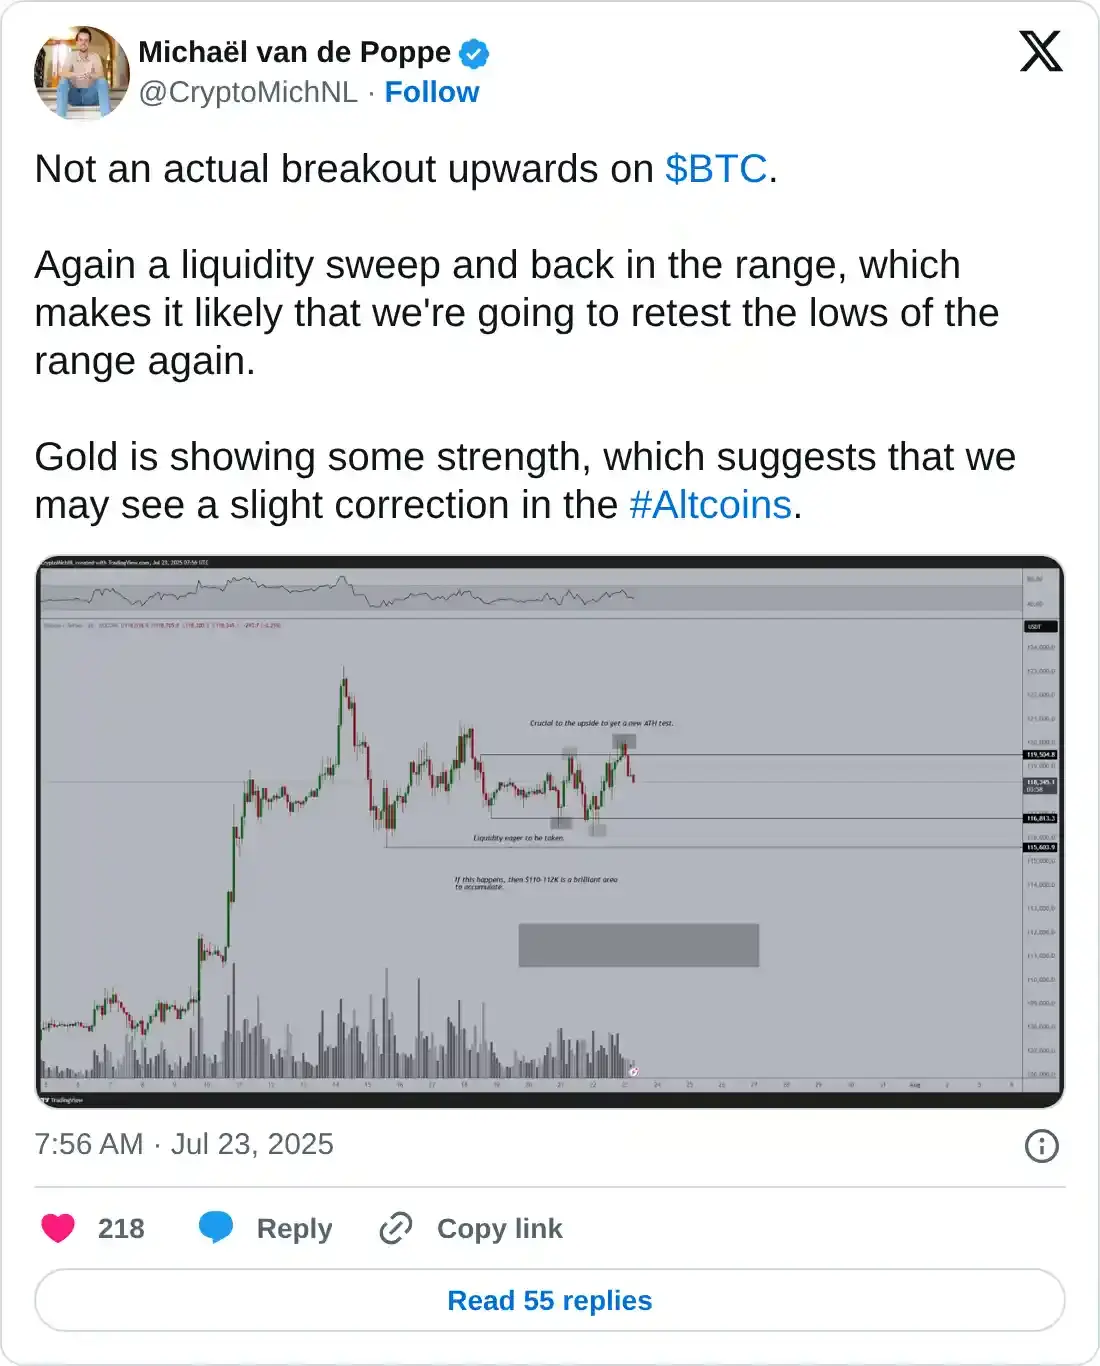
Bitcoin is extending its intraday down leg toward near-term support at $118,000 at the time of writing, backed by a downtrending Relative Strength Index (RSI) at 62. As the RSI falls, it suggests that buying pressure is shrinking. Michaël van de Poppe, a crypto analyst and investor, notes that Bitcoin could extend the decline to a lower range of $115,603 to $116,813 before regaining bullish momentum.
A glance at the Moving Average Convergence Divergence (MACD) indicator shows that the spot market inclines bearishly on the daily chart. This outlook could stand out if the blue MACD line closes below the red signal line, prompting investors to consider reducing their exposure.
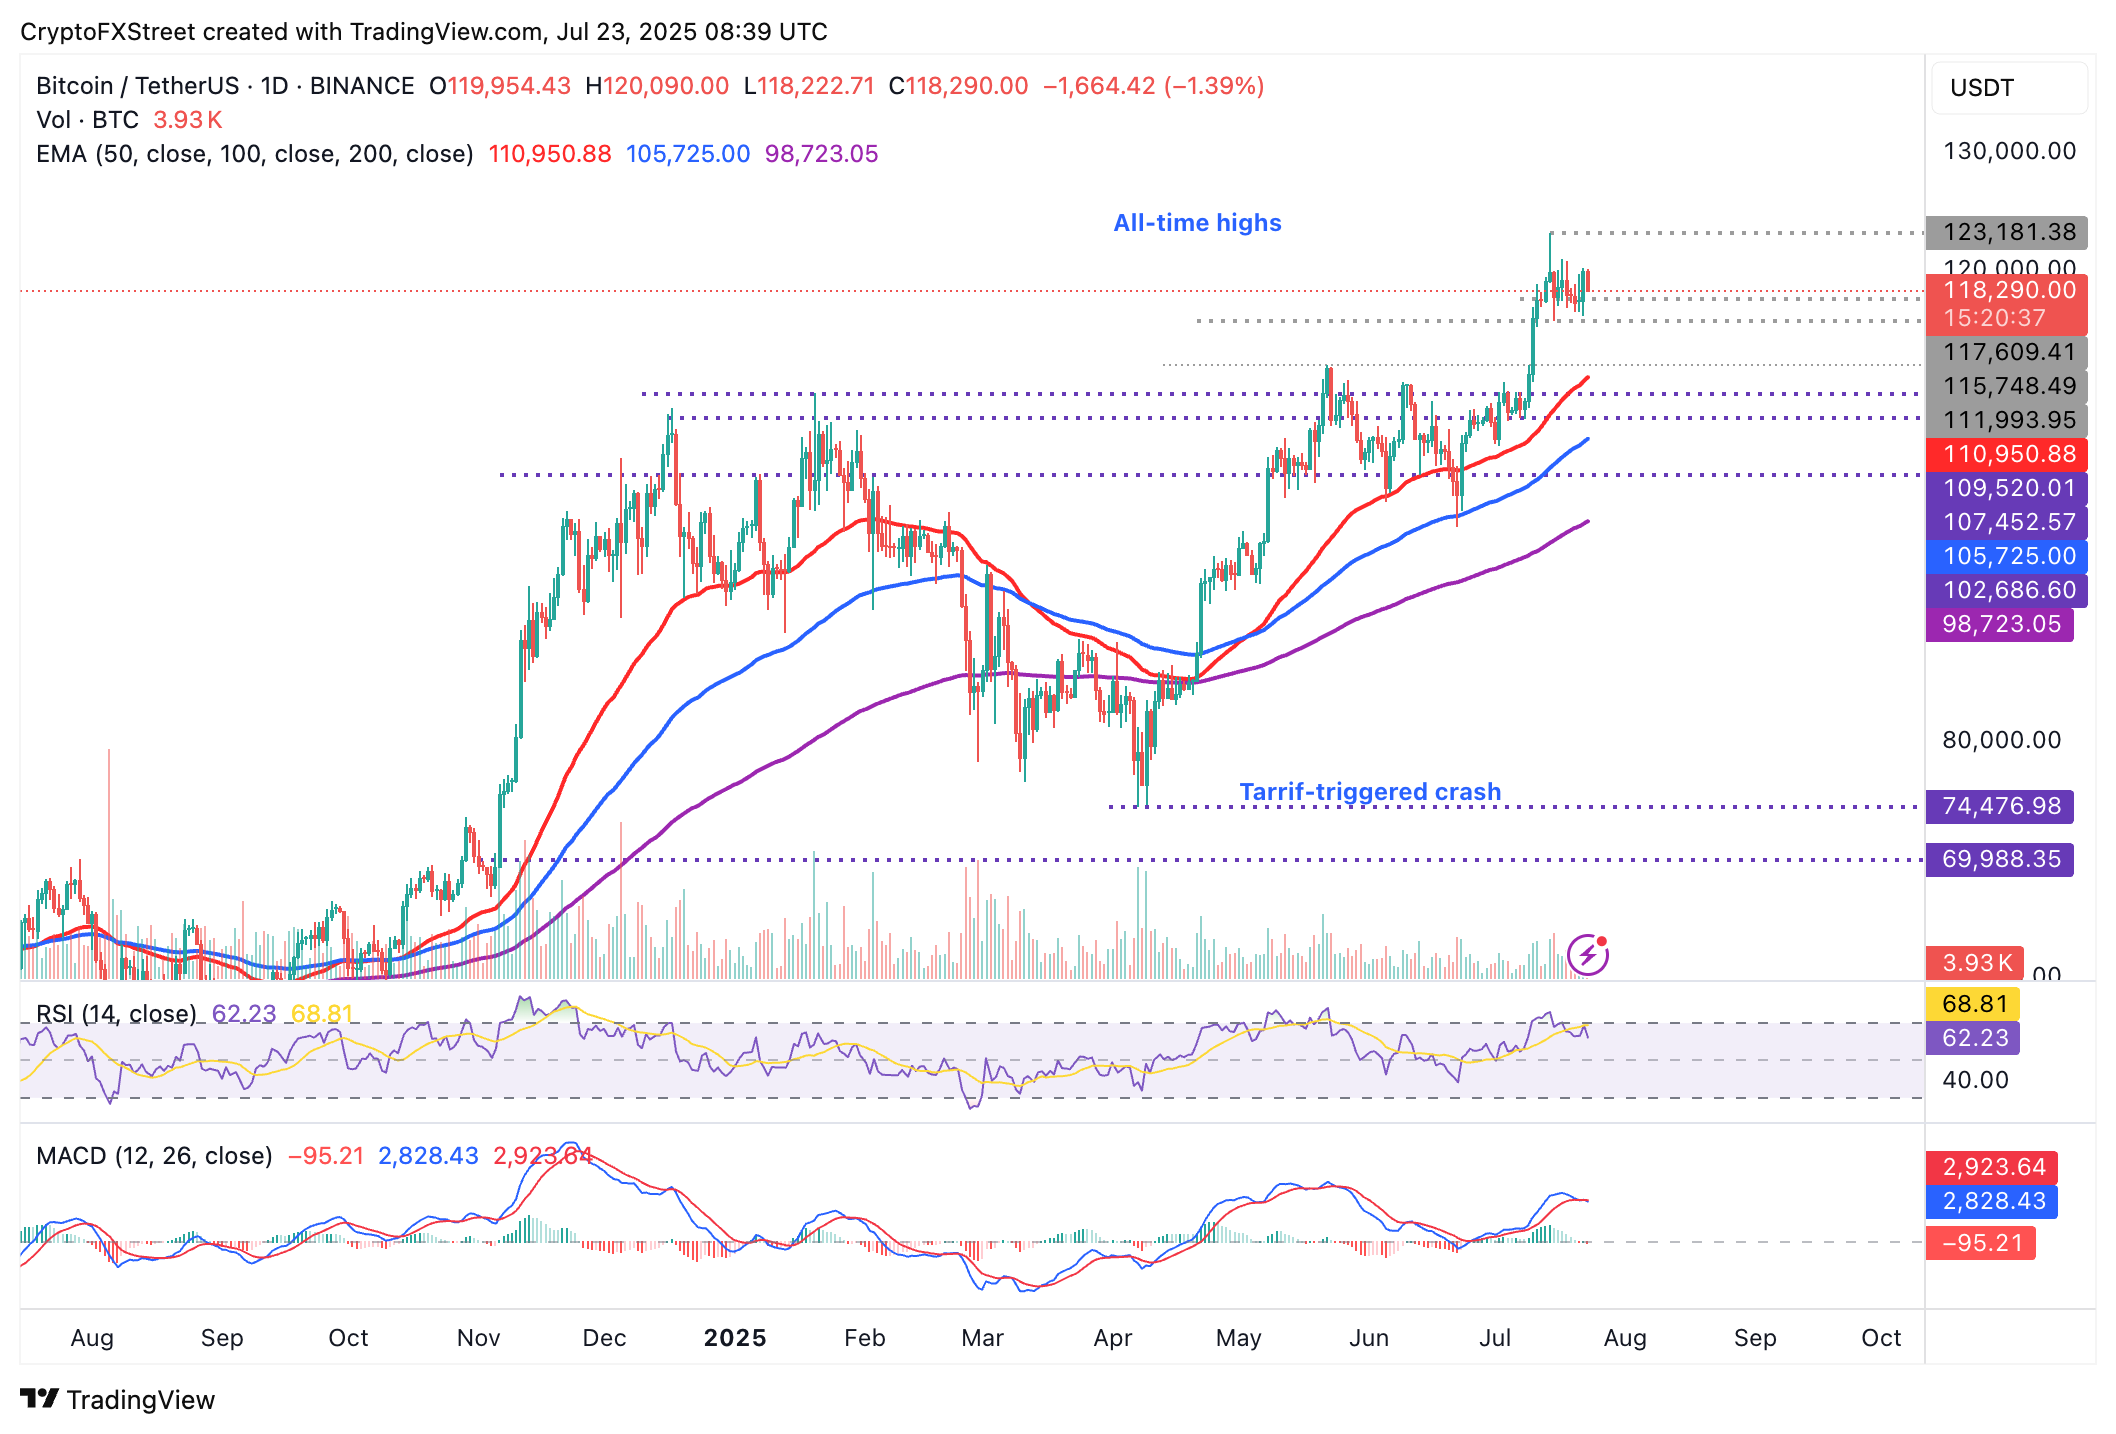
BTC/USDT daily chart
Altcoins update: Ethereum, XRP uptrend falters
Ethereum is in the red, trading at around $3,652 at the time of writing. With the RSI still relatively overheated but declining, the path of least resistance could remain downward in upcoming sessions until demand starts to overshadow supply.
The next key support level in line to absorb selling pressure is $3,500, which was tested in late December and early January as resistance. If the headwinds intensify, the MACD indicator would confirm a sell signal, encouraging traders to consider reducing exposure.
However, with institutional and retail interest backing the recent surge in price, traders should temper their bearish expectations. A recovery could ensue, propelling the price of ETH toward the $4,000 milestone.
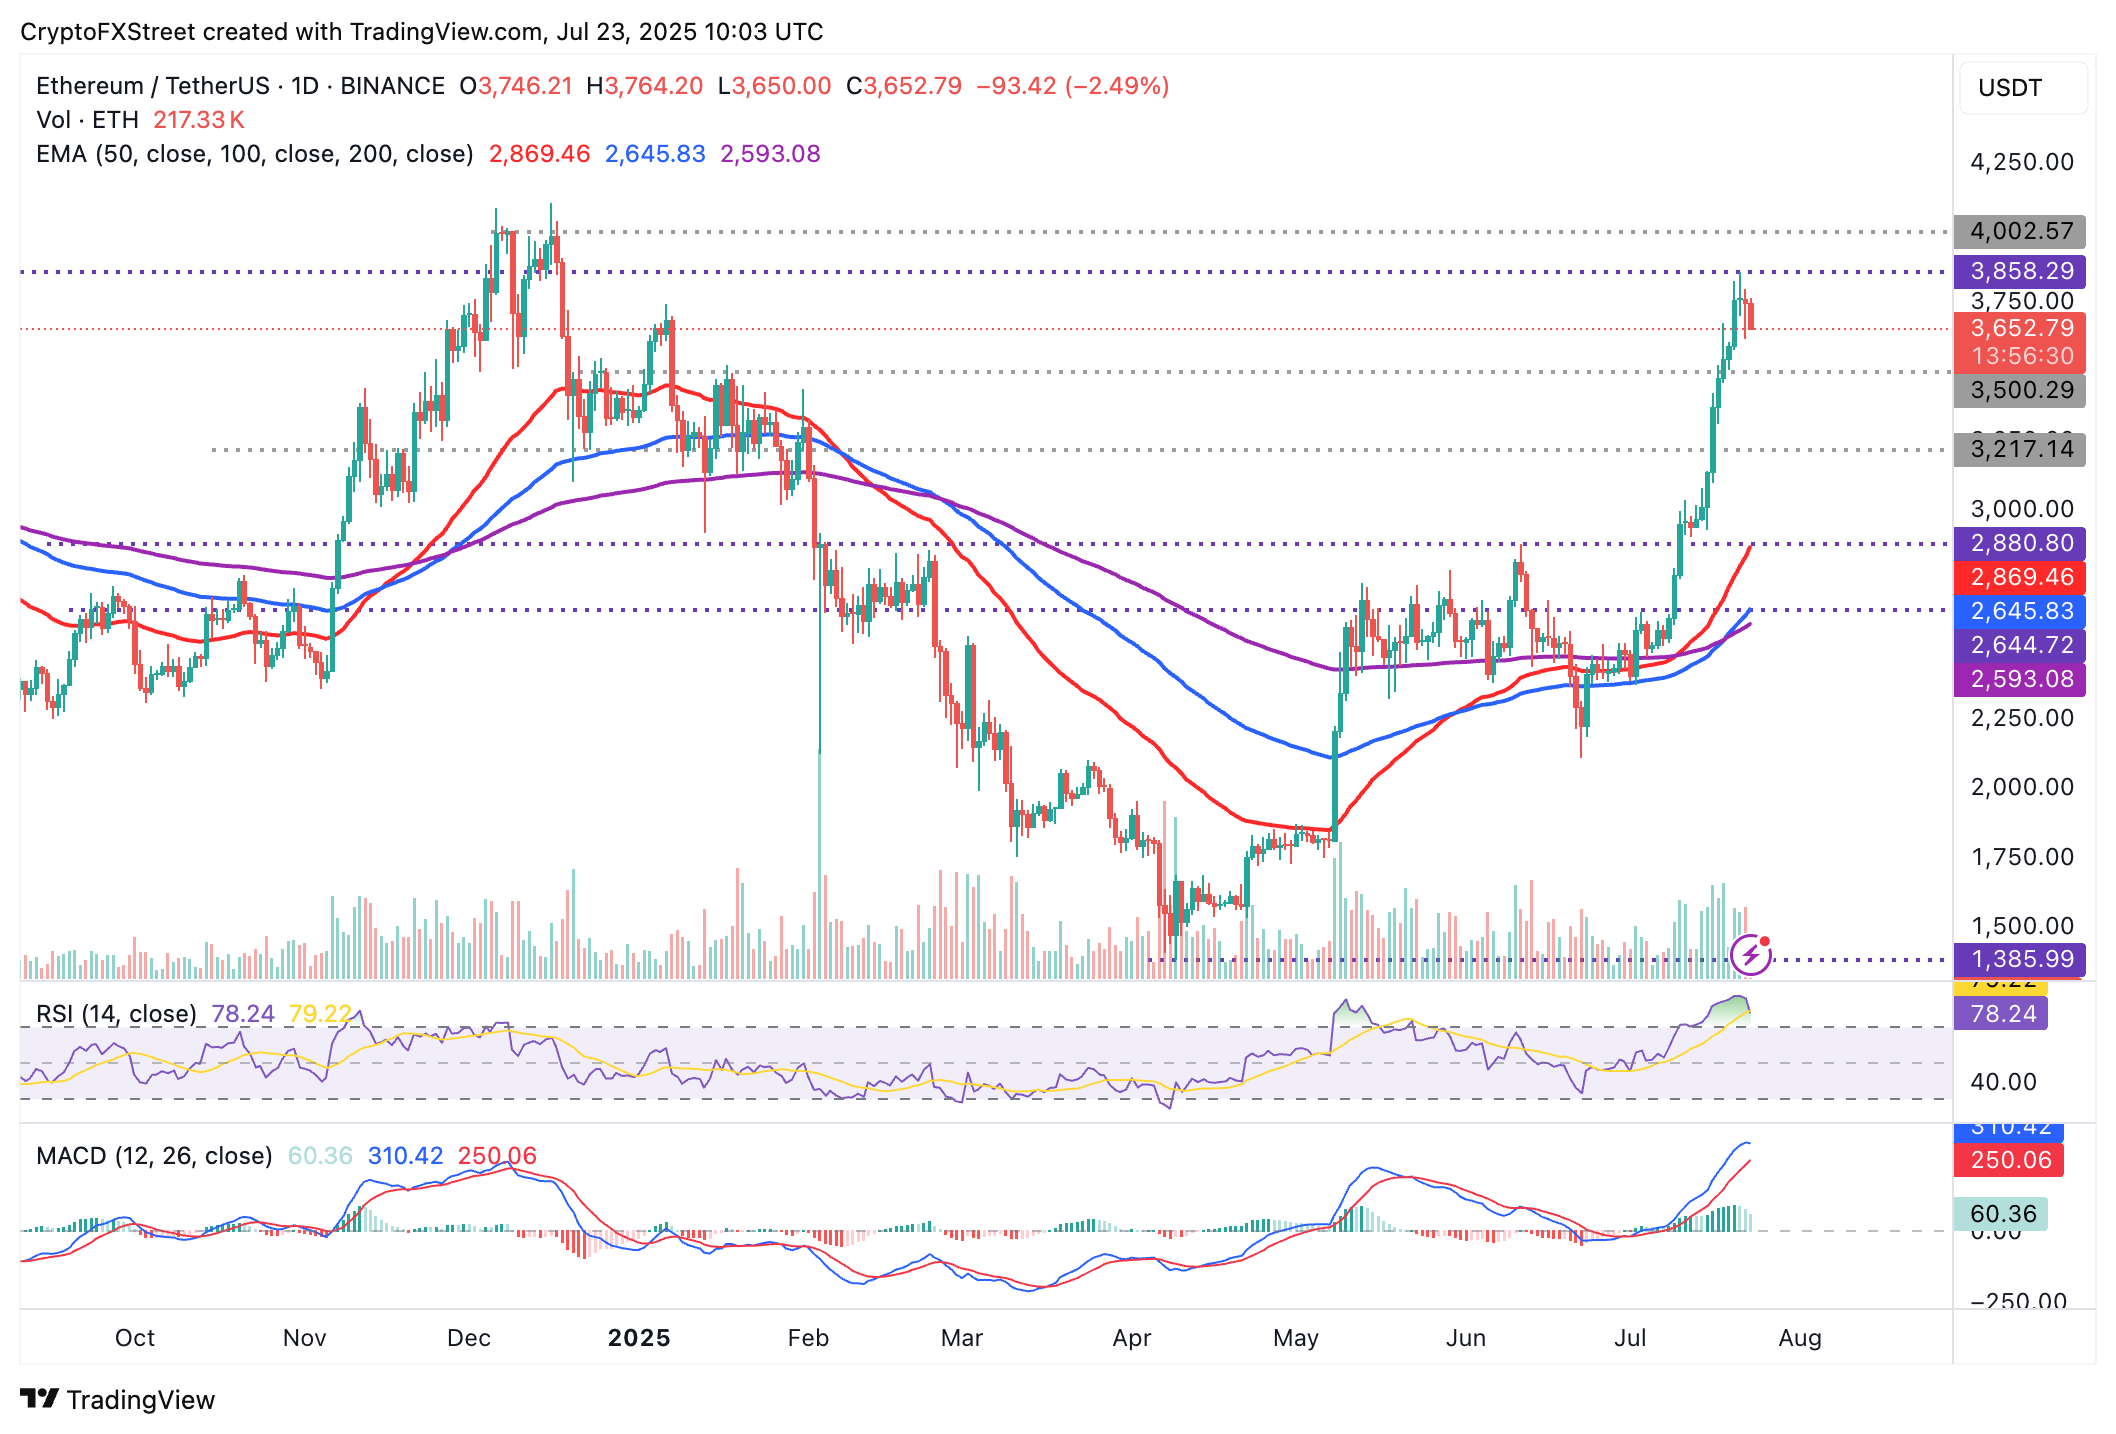
ETH/USDT daily chart
As for XRP, bears appear to be gaining control amid an overheated RSI on the daily chart, which is overbought at 77. If the RSI continues to decline, it would signal a reduction in buying pressure, resulting in the XRP price falling to test lower levels in search of strong support.
The previous record high of $3.40 set on January 16 is worth watching as a key tentative support level. A rebound from this level could sustain the uptrend, targeting the record high at $3.66 and the subsequent price discovery phase.
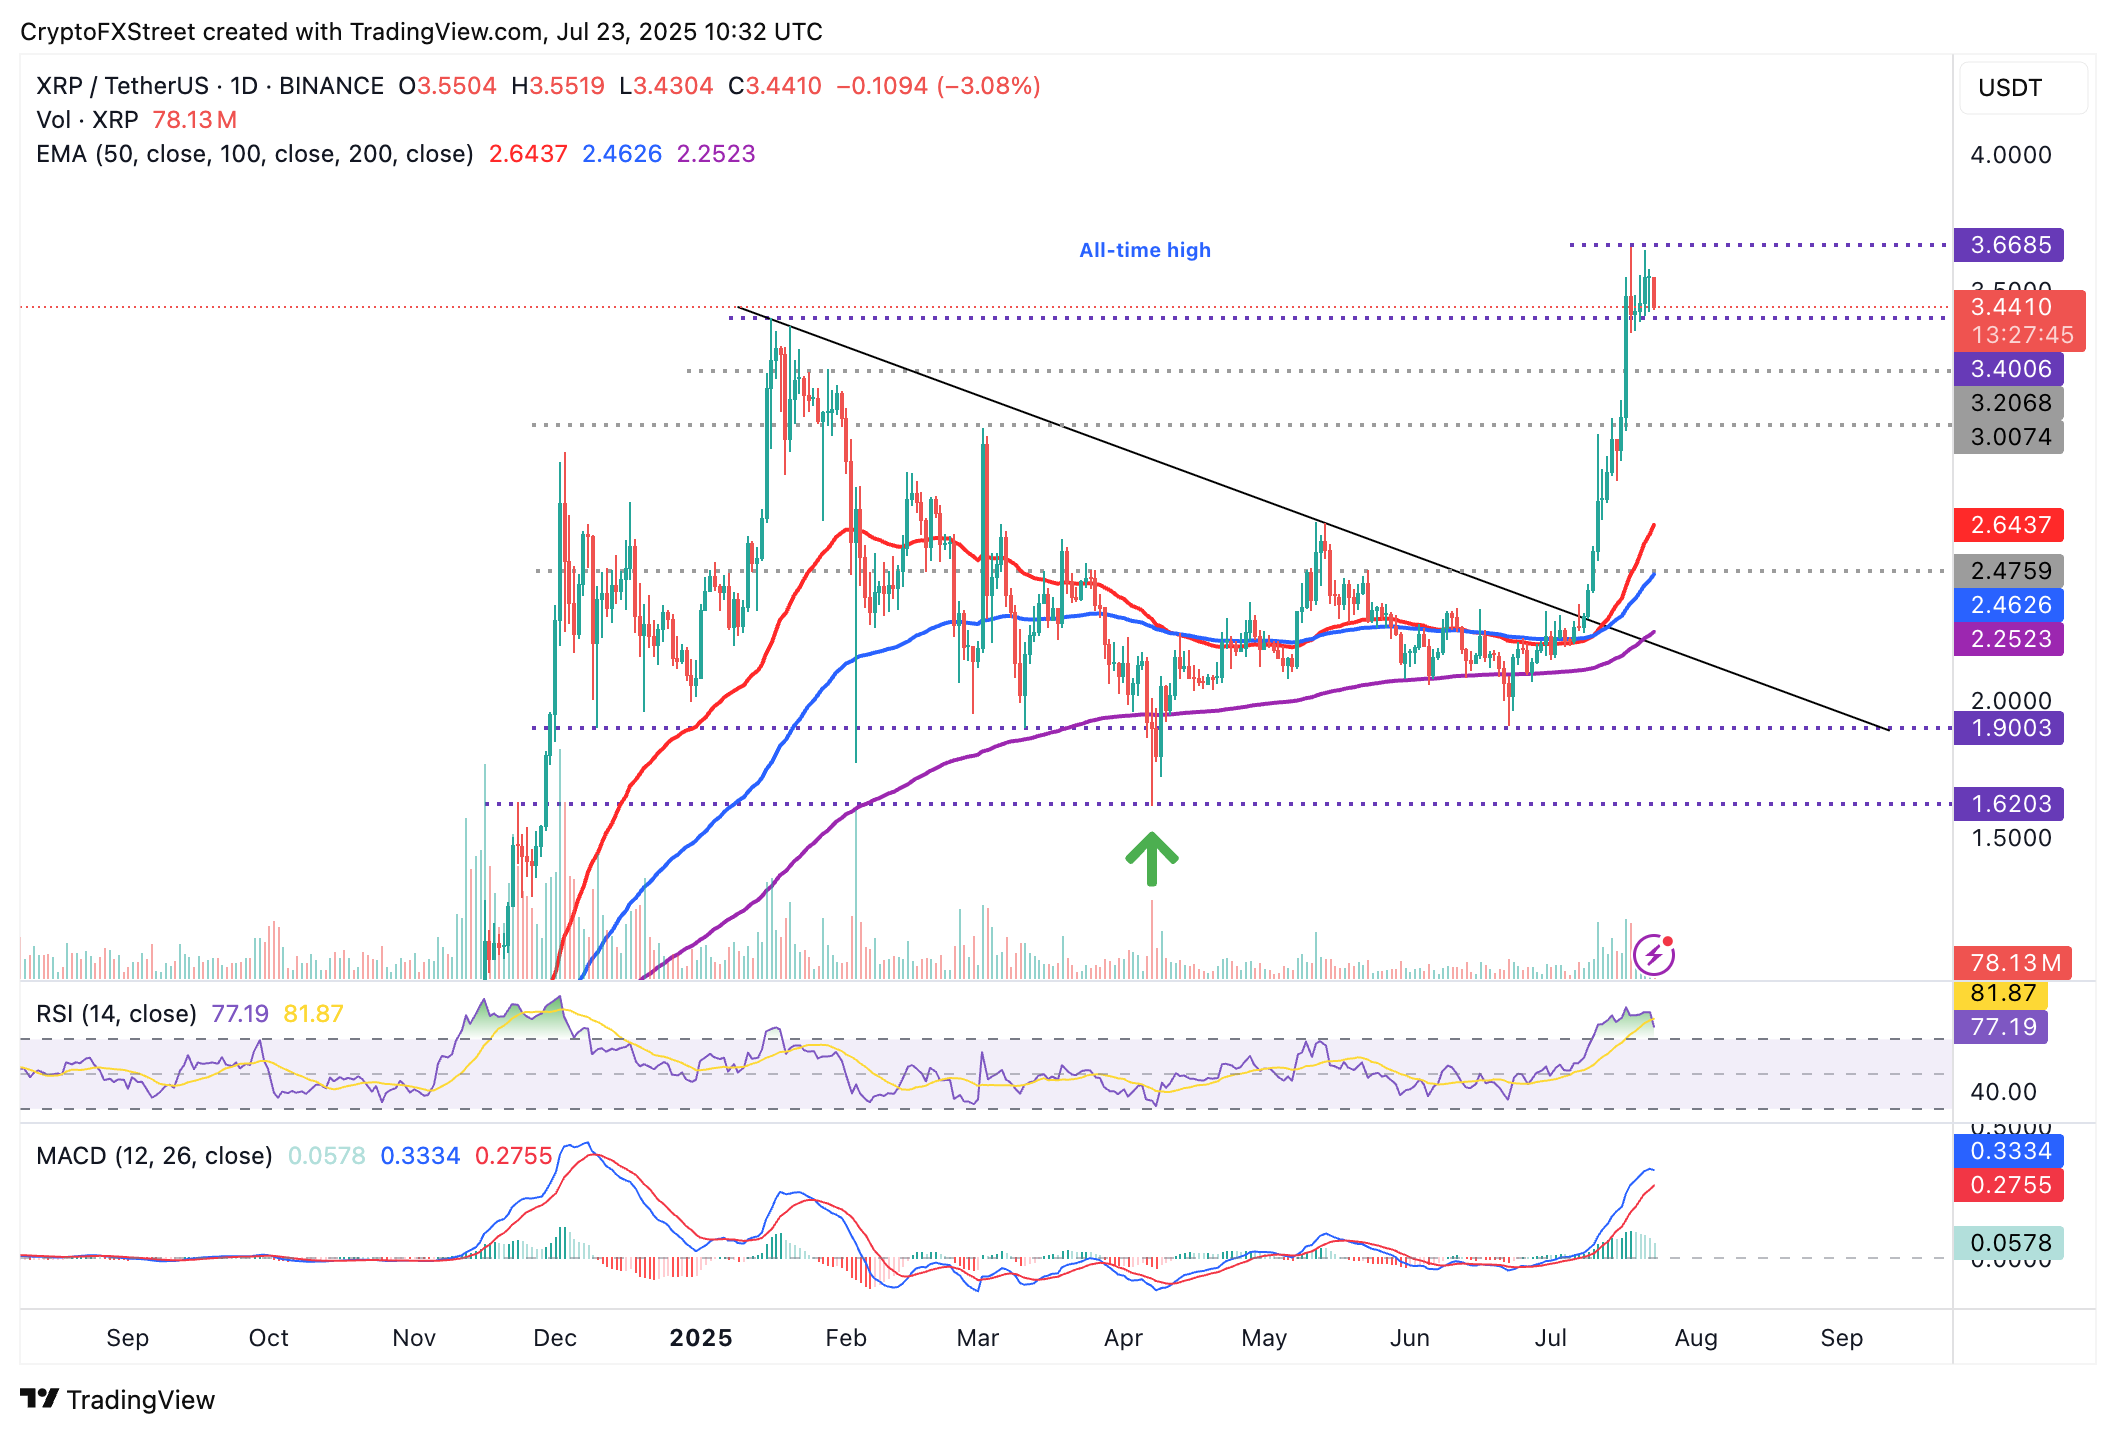
XRP/USDT daily chart
Still, an extended drop below the $3.40 level cannot be ruled out yet, especially with the RSI still overheated. Notably, a drop in spot volume to the current $78 million could make it difficult for bulls to tighten their grip, leaving XRP susceptible to increasing supply amid a slump in buying pressure.
Open Interest, funding rate FAQs
Higher Open Interest is associated with higher liquidity and new capital inflow to the market. This is considered the equivalent of increase in efficiency and the ongoing trend continues. When Open Interest decreases, it is considered a sign of liquidation in the market, investors are leaving and the overall demand for an asset is on a decline, fueling a bearish sentiment among investors.
Funding fees bridge the difference between spot prices and prices of futures contracts of an asset by increasing liquidation risks faced by traders. A consistently high and positive funding rate implies there is a bullish sentiment among market participants and there is an expectation of a price hike. A consistently negative funding rate for an asset implies a bearish sentiment, indicating that traders expect the cryptocurrency’s price to fall and a bearish trend reversal is likely to occur.
Author

John Isige
FXStreet
John Isige is a seasoned cryptocurrency journalist and markets analyst committed to delivering high-quality, actionable insights tailored to traders, investors, and crypto enthusiasts. He enjoys deep dives into emerging Web3 tren


