Crypto Today: Bitcoin, Ethereum, XRP edge lower as investors reduce risk exposure
- Bitcoin extends intraday losses below $108,000 on Tuesday amid persistent macroeconomic uncertainty.
- Ethereum faces increasing selling pressure, sliding below $3,900 as bearish sentiment engulfs the broader crypto market.
- The XRP derivatives market shows signs of stability, but overhead pressure keeps the price suppressed below $2.50.

Bitcoin (BTC) declines alongside altcoin majors Ethereum (ETH) and Ripple (XRP) on Tuesday, as global markets, including cryptocurrency, struggle amid sticky macroeconomic uncertainty, geopolitical tensions and the impact of the prolonged United States (US) government shutdown.
The largest cryptocurrency by market capitalization, BTC, is trading below $108,000 at the time of writing after reclaiming its position above $111,000 on Monday. Similarly, Ethereum resumed its downtrend below the $4,000 level, reflecting risk-off sentiment across the crypto market.
XRP remains largely in bearish hands, sliding below the $2.50 mark despite signs that the derivatives market is stabilizing.
Data spotlight: Bitcoin, Ethereum Open Interest plunge mirrors risk-off sentiment
Bitcoin futures Open Interest (OI) is down approximately 23% to $72 billion on Tuesday after peaking at an all-time high of $94.12 billion on October 7, according to CoinGlass data.
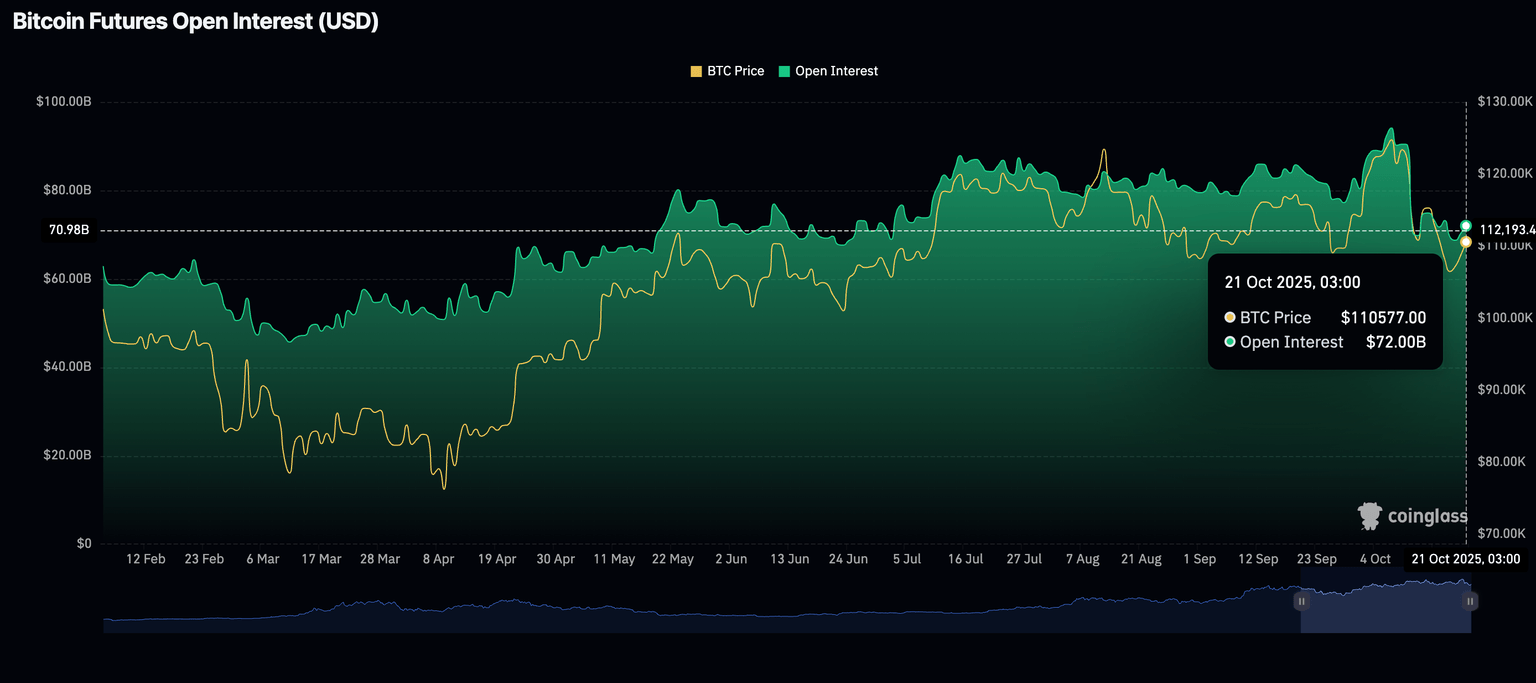
Bitcoin Futures Open Interest | Source: CoinGlass
The decrease in OI, representing the notional value of outstanding futures contracts, indicates the persistent risk-off sentiment in the wider crypto market. Investors stay on the sidelines amid macroeconomic uncertainty, stemming from the trade standoff between the US and China and geopolitical tensions in the Middle East.
A prolonged downtrend would mean a lack of conviction in Bitcoin’s ability to sustain recovery toward its record high of $126,199, reached on October 6. This scenario could suppress the Bitcoin price near its October low of $102,000.
The Ethereum derivatives market shows a similar risk-averse pattern, whereby investors actively deleverage and reduce risk exposure. After peaking at an all-time high of $70.13 billion in late August, the futures OI averages $44 billion on Tuesday, representing a 37.3% decline. The chart below highlights the top-heavy trend likely to last longer as it moves with market sentiment.
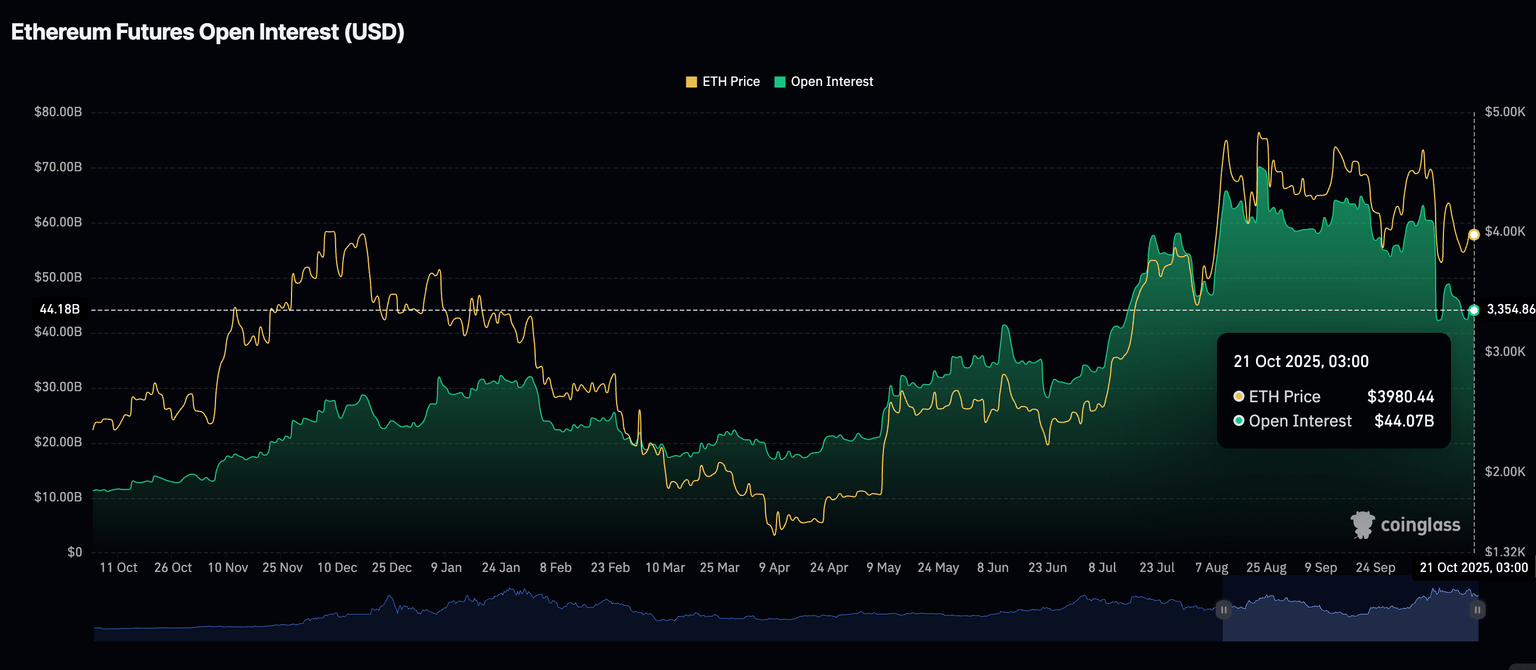
Ethereum Futures Open Interest | Source: CoinGlass
Meanwhile, the XRP derivatives market is stabilizing, as evidenced by the futures OI recovering to $3.8 billion from approximately $3.5 billion on Sunday. Although minor, the uptick reflects a potential shift in sentiment from bearish to bullish.
The XRP OI peaked at $10.94 billion days after the price reached a historical high of $3.66 on July 18, underscoring the impact of steady retail demand. Hence, there is a need for a steady uptrend in OI to bolster bullish momentum.
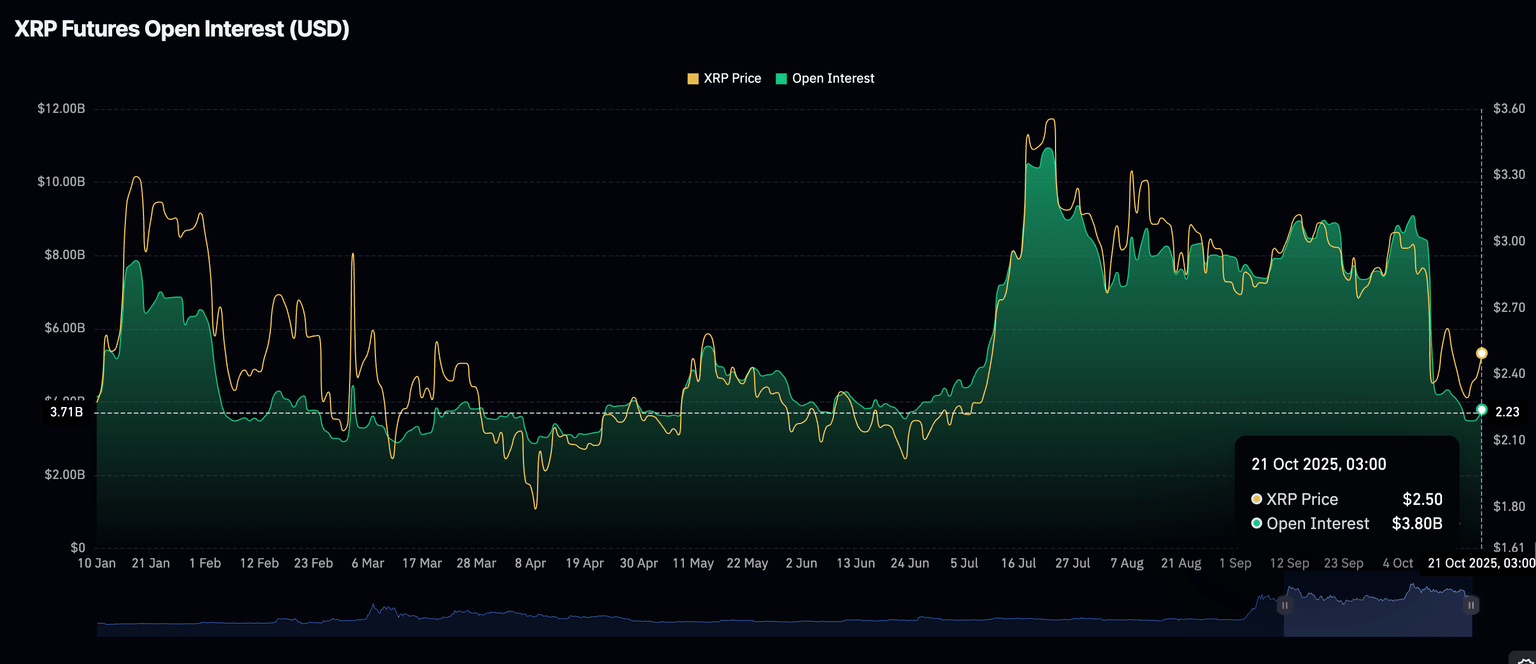
XRP Futures Open Interest | Source: CoinGlass
Chart of the day: Bitcoin extends decline below key support
As bears tightened their grip, Bitcoin’s downtrend stretched below the 200-day Exponential Moving Average (EMA) support currently at $108,062 on Tuesday. The decline trimmed most of the gains accrued with Bitcoin, briefly holding above $111,000 on Monday.
The path of least resistance leans downward, especially with the Moving Average Convergence Divergence (MACD) indicator on the daily chart maintaining a sell signal since October 10. As investors reduce exposure to BTC to lock in gains and protect capital, they contribute to selling pressure. The Relative Strength Index (RSI) falling at 39 reinforces the the bearish outlook.
A daily close below the 200-day EMA may confirm a strong bearish grip, increasing the odds of an extended downtrend toward the $102,000 October low. Conversely, recovery above the same moving average could encourage investors to rejoin the market, anticipating a steady uptrend above the $110,000 round-number level.
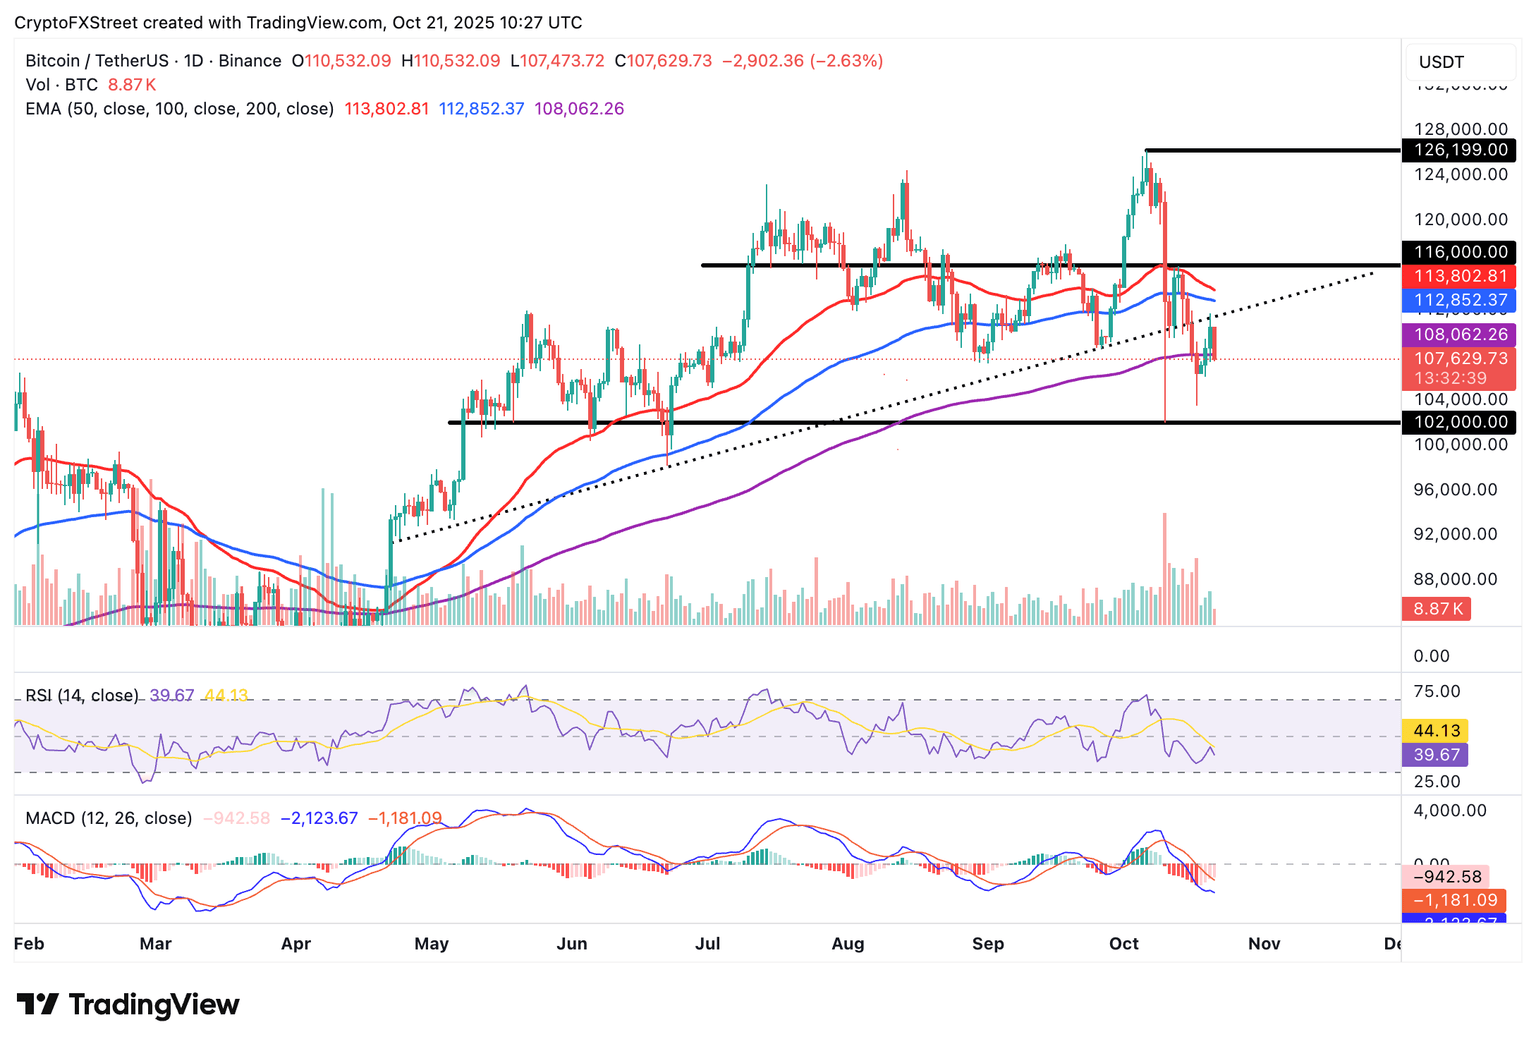
BTC/USDT daily chart
Altcoins update: Ethereum, XRP bears tightened grip
Ethereum is positioned below the 50-day EMA at $4,165 and the 100-day EMA at $3,970 on the daily chart, underpinning a top-heavy technical structure. A down-trending Relative Strength Index (RSI) at 41 in the same daily range confirms that bullish momentum is easing.
Investors may be inclined to stay on the sidelines or reduce risk exposure, citing negative sentiment with the MACD indicator upholding a bearish signal since October 10.
If the decline expands, focus will turn toward the next key support at $3,680, which was tested on Friday and the 200-day EMA at $3,566.
Still, an immediate recovery could occur above the 100-day EMA at $3,970 if bulls buy the dip, contributing to buying pressure.
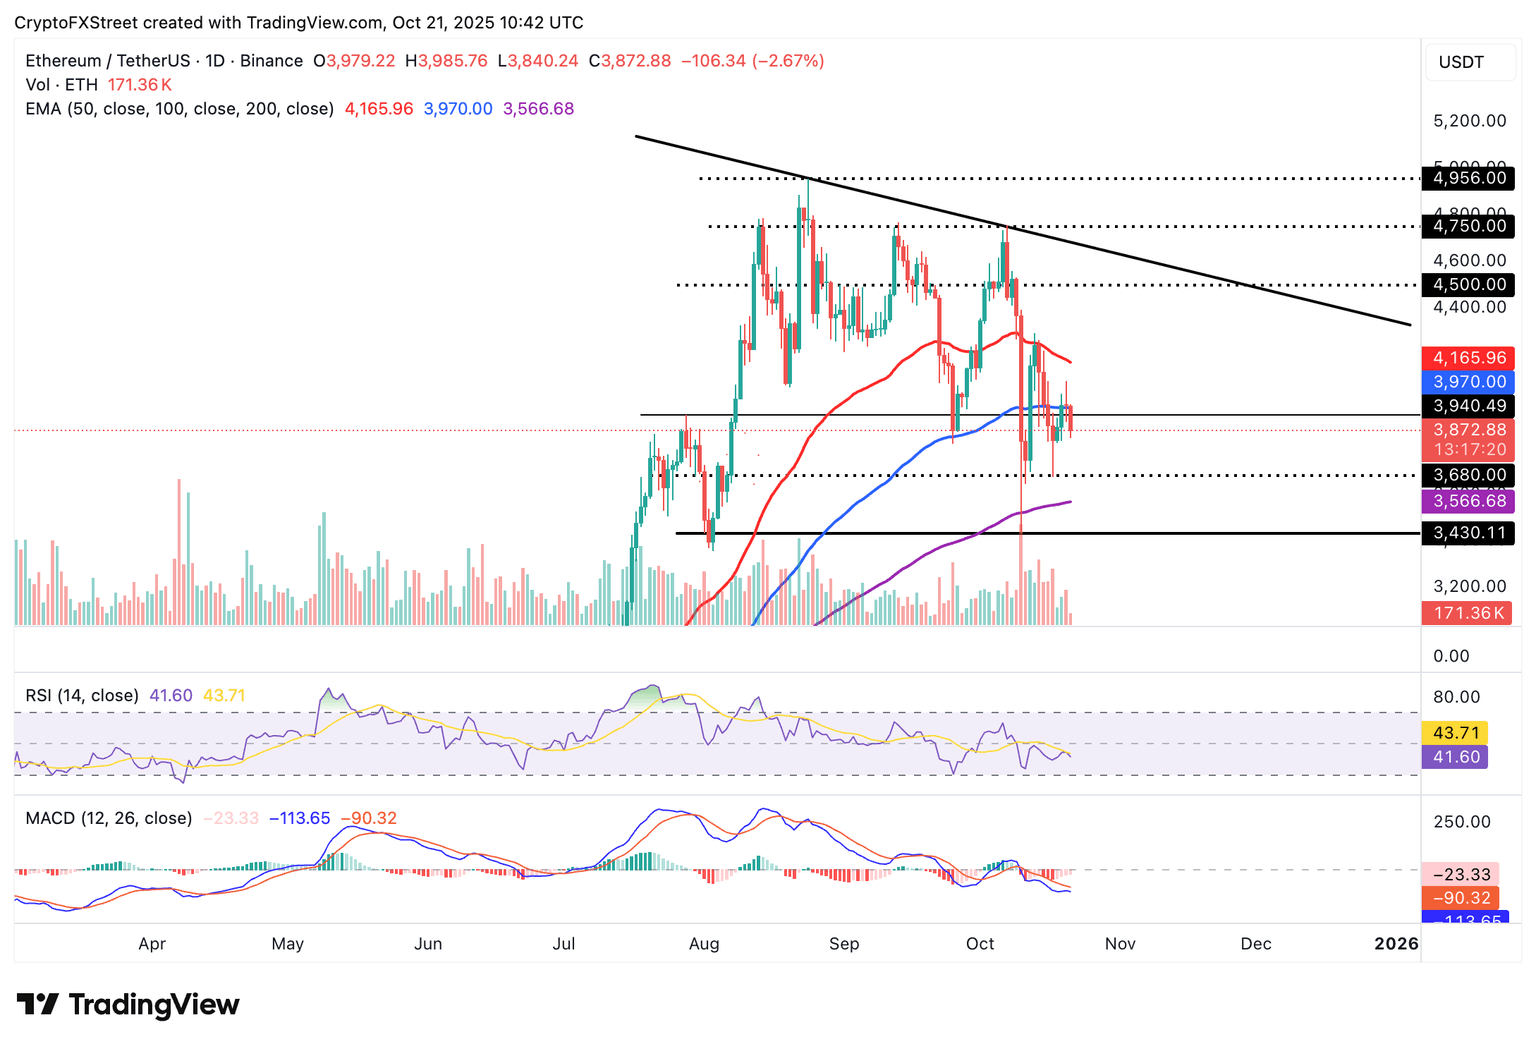
ETH/USDT daily chart
As for XRP, bulls are battling to keep the price above $2.40 at the time of writing on Tuesday. A Death Cross pattern on the daily chart, formed when the 50-day EMA crossed below the 100-day EMA, pointsa to relentless negative sentiment in the market.
Traders should be watchful for price action below $2.40, which may keep bears determined to push XRP to the next level at $2.18, as tested on Friday. The MACD indicator remains bearish as shown on the daily chart, with investors likely to continue deleveraging.
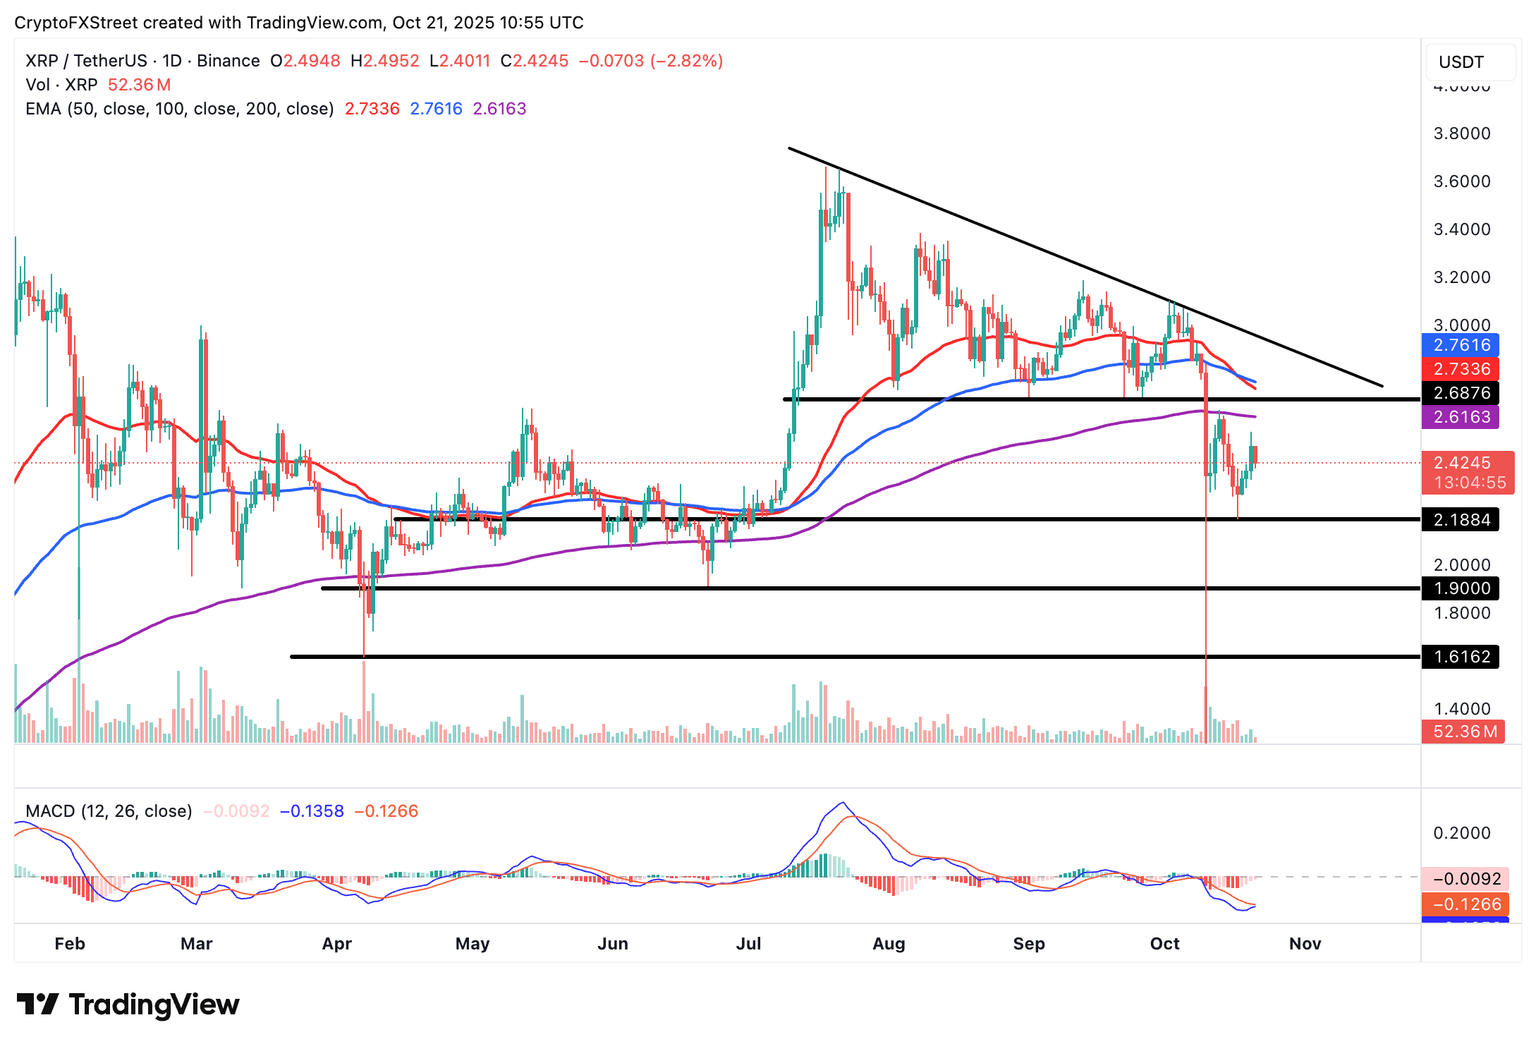
XRP/USDT daily chart
If sentiment improves in the broader crypto market and investors gain interest in longing XRP, a recovery above the 200-day EMA at $2.61 could pave the way for a sustainable uptrend.
Open Interest, funding rate FAQs
Higher Open Interest is associated with higher liquidity and new capital inflow to the market. This is considered the equivalent of increase in efficiency and the ongoing trend continues. When Open Interest decreases, it is considered a sign of liquidation in the market, investors are leaving and the overall demand for an asset is on a decline, fueling a bearish sentiment among investors.
Funding fees bridge the difference between spot prices and prices of futures contracts of an asset by increasing liquidation risks faced by traders. A consistently high and positive funding rate implies there is a bullish sentiment among market participants and there is an expectation of a price hike. A consistently negative funding rate for an asset implies a bearish sentiment, indicating that traders expect the cryptocurrency’s price to fall and a bearish trend reversal is likely to occur.
Author

John Isige
FXStreet
John Isige is a seasoned cryptocurrency journalist and markets analyst committed to delivering high-quality, actionable insights tailored to traders, investors, and crypto enthusiasts. He enjoys deep dives into emerging Web3 tren


