Crypto Market Down: Bonk, Sonic, and Fartcoin lead the losses as downside risk escalates
- Bonk extends the losses from Tuesday, eyeing a retest of the 200-day EMA.
- Sonic’s downfall extends within a falling wedge, risking further losses.
- Fartcoin fails to hold above $1 and the 200-day EMA, with eyes now on retesting $0.73.

The broader cryptocurrency market is in the red, with 24-hour liquidations exceeding $350 million at press time. Bonk (BONK), Sonic (S), and Fartcoin (FARTCOIN) emerge as top losers with double-digit losses. The technical outlook sends mixed signals, while the downside risk remains real and intensifies.
Bonk at crucial support, risks a fallout
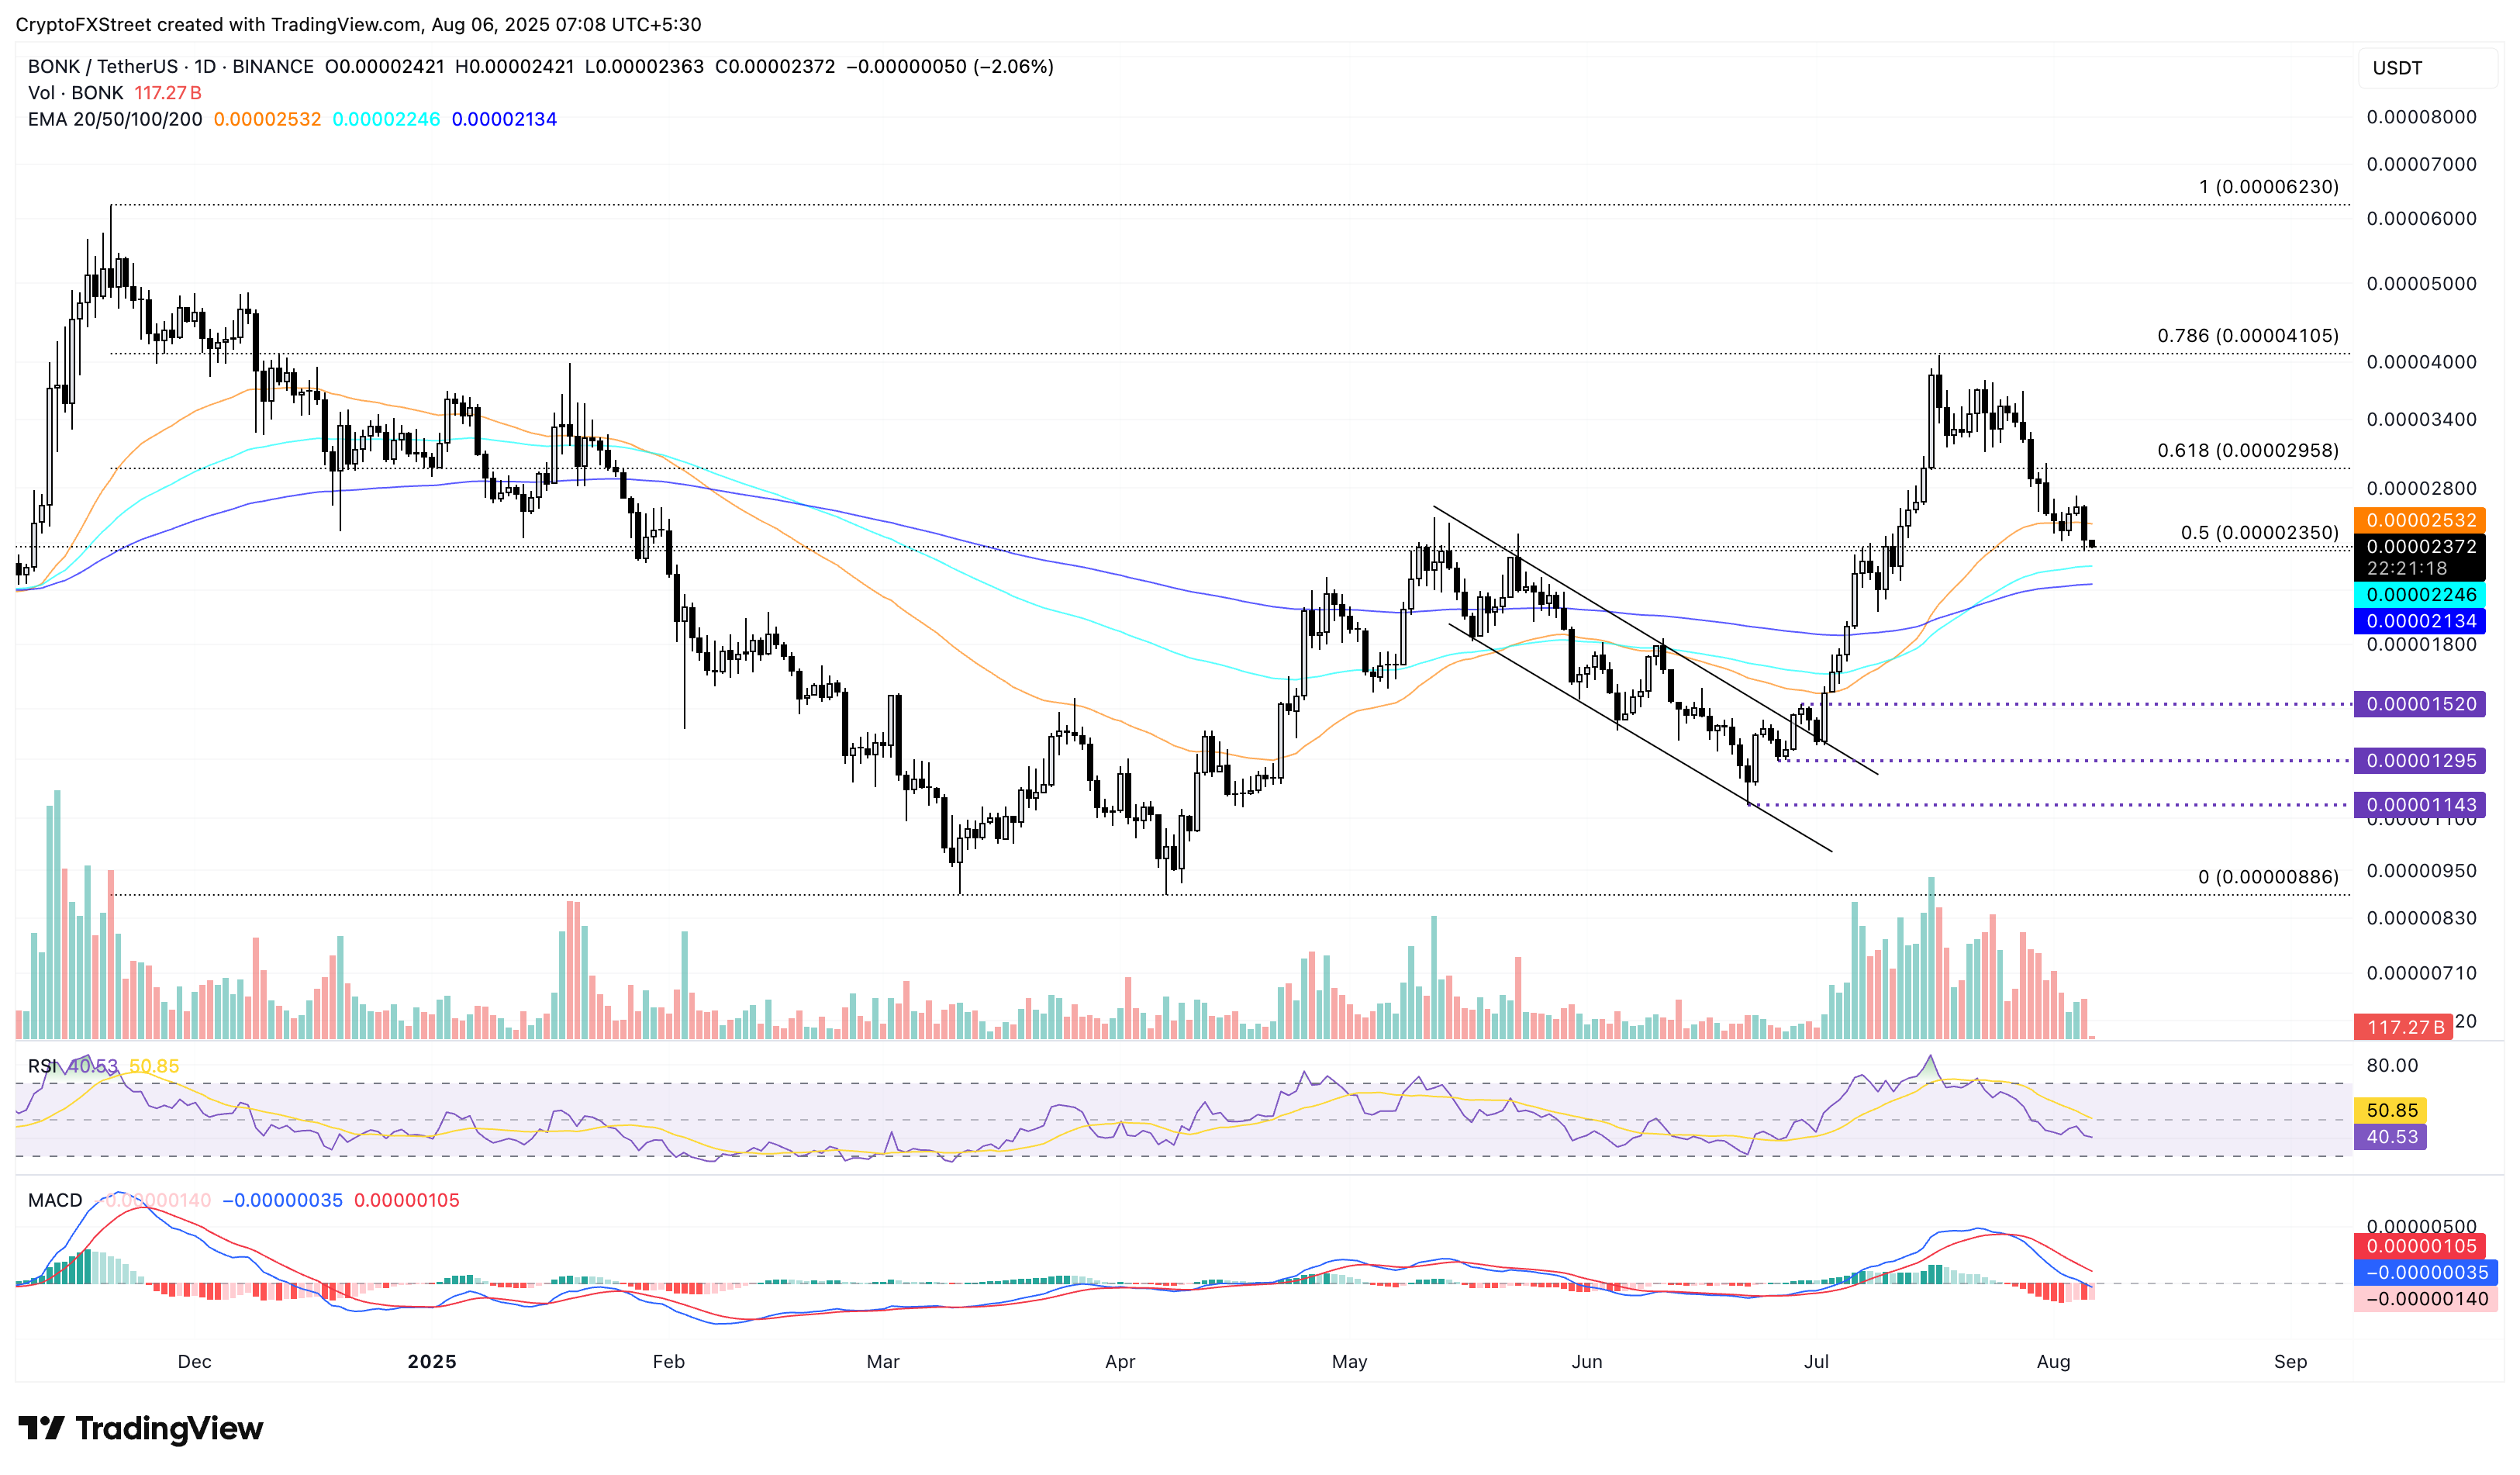
Bonk edges lower by 2% at press time on Wednesday, extending the 8% drop from the previous day. The meme coin, losing steam, falls below the 50% retracement level at $0.00002350, drawn from $0.00006230 on November 20 to $0.00000886 on April 7.
A decisive close below this support level could extend the decline to the 200-day Exponential Moving Average (EMA) at $0.00002134.
BONK’s path of least resistance projects a declining trend amid waning bullish momentum. The Moving Average Convergence Divergence (MACD) line declines in relation to its signal line, moving towards the zero line, which suggests a bearish shift in momentum.
The Relative Strength Index (RSI) is at 40, inching closer to the oversold zone with room on the downside.
BONK/USDT daily price chart.
Looking up, a reversal from the 50% retracement level at $0.00002350 could test the 61.8% Fibonacci level at $0.00002958.
Sonic risks a steeper correction as bearish momentum builds
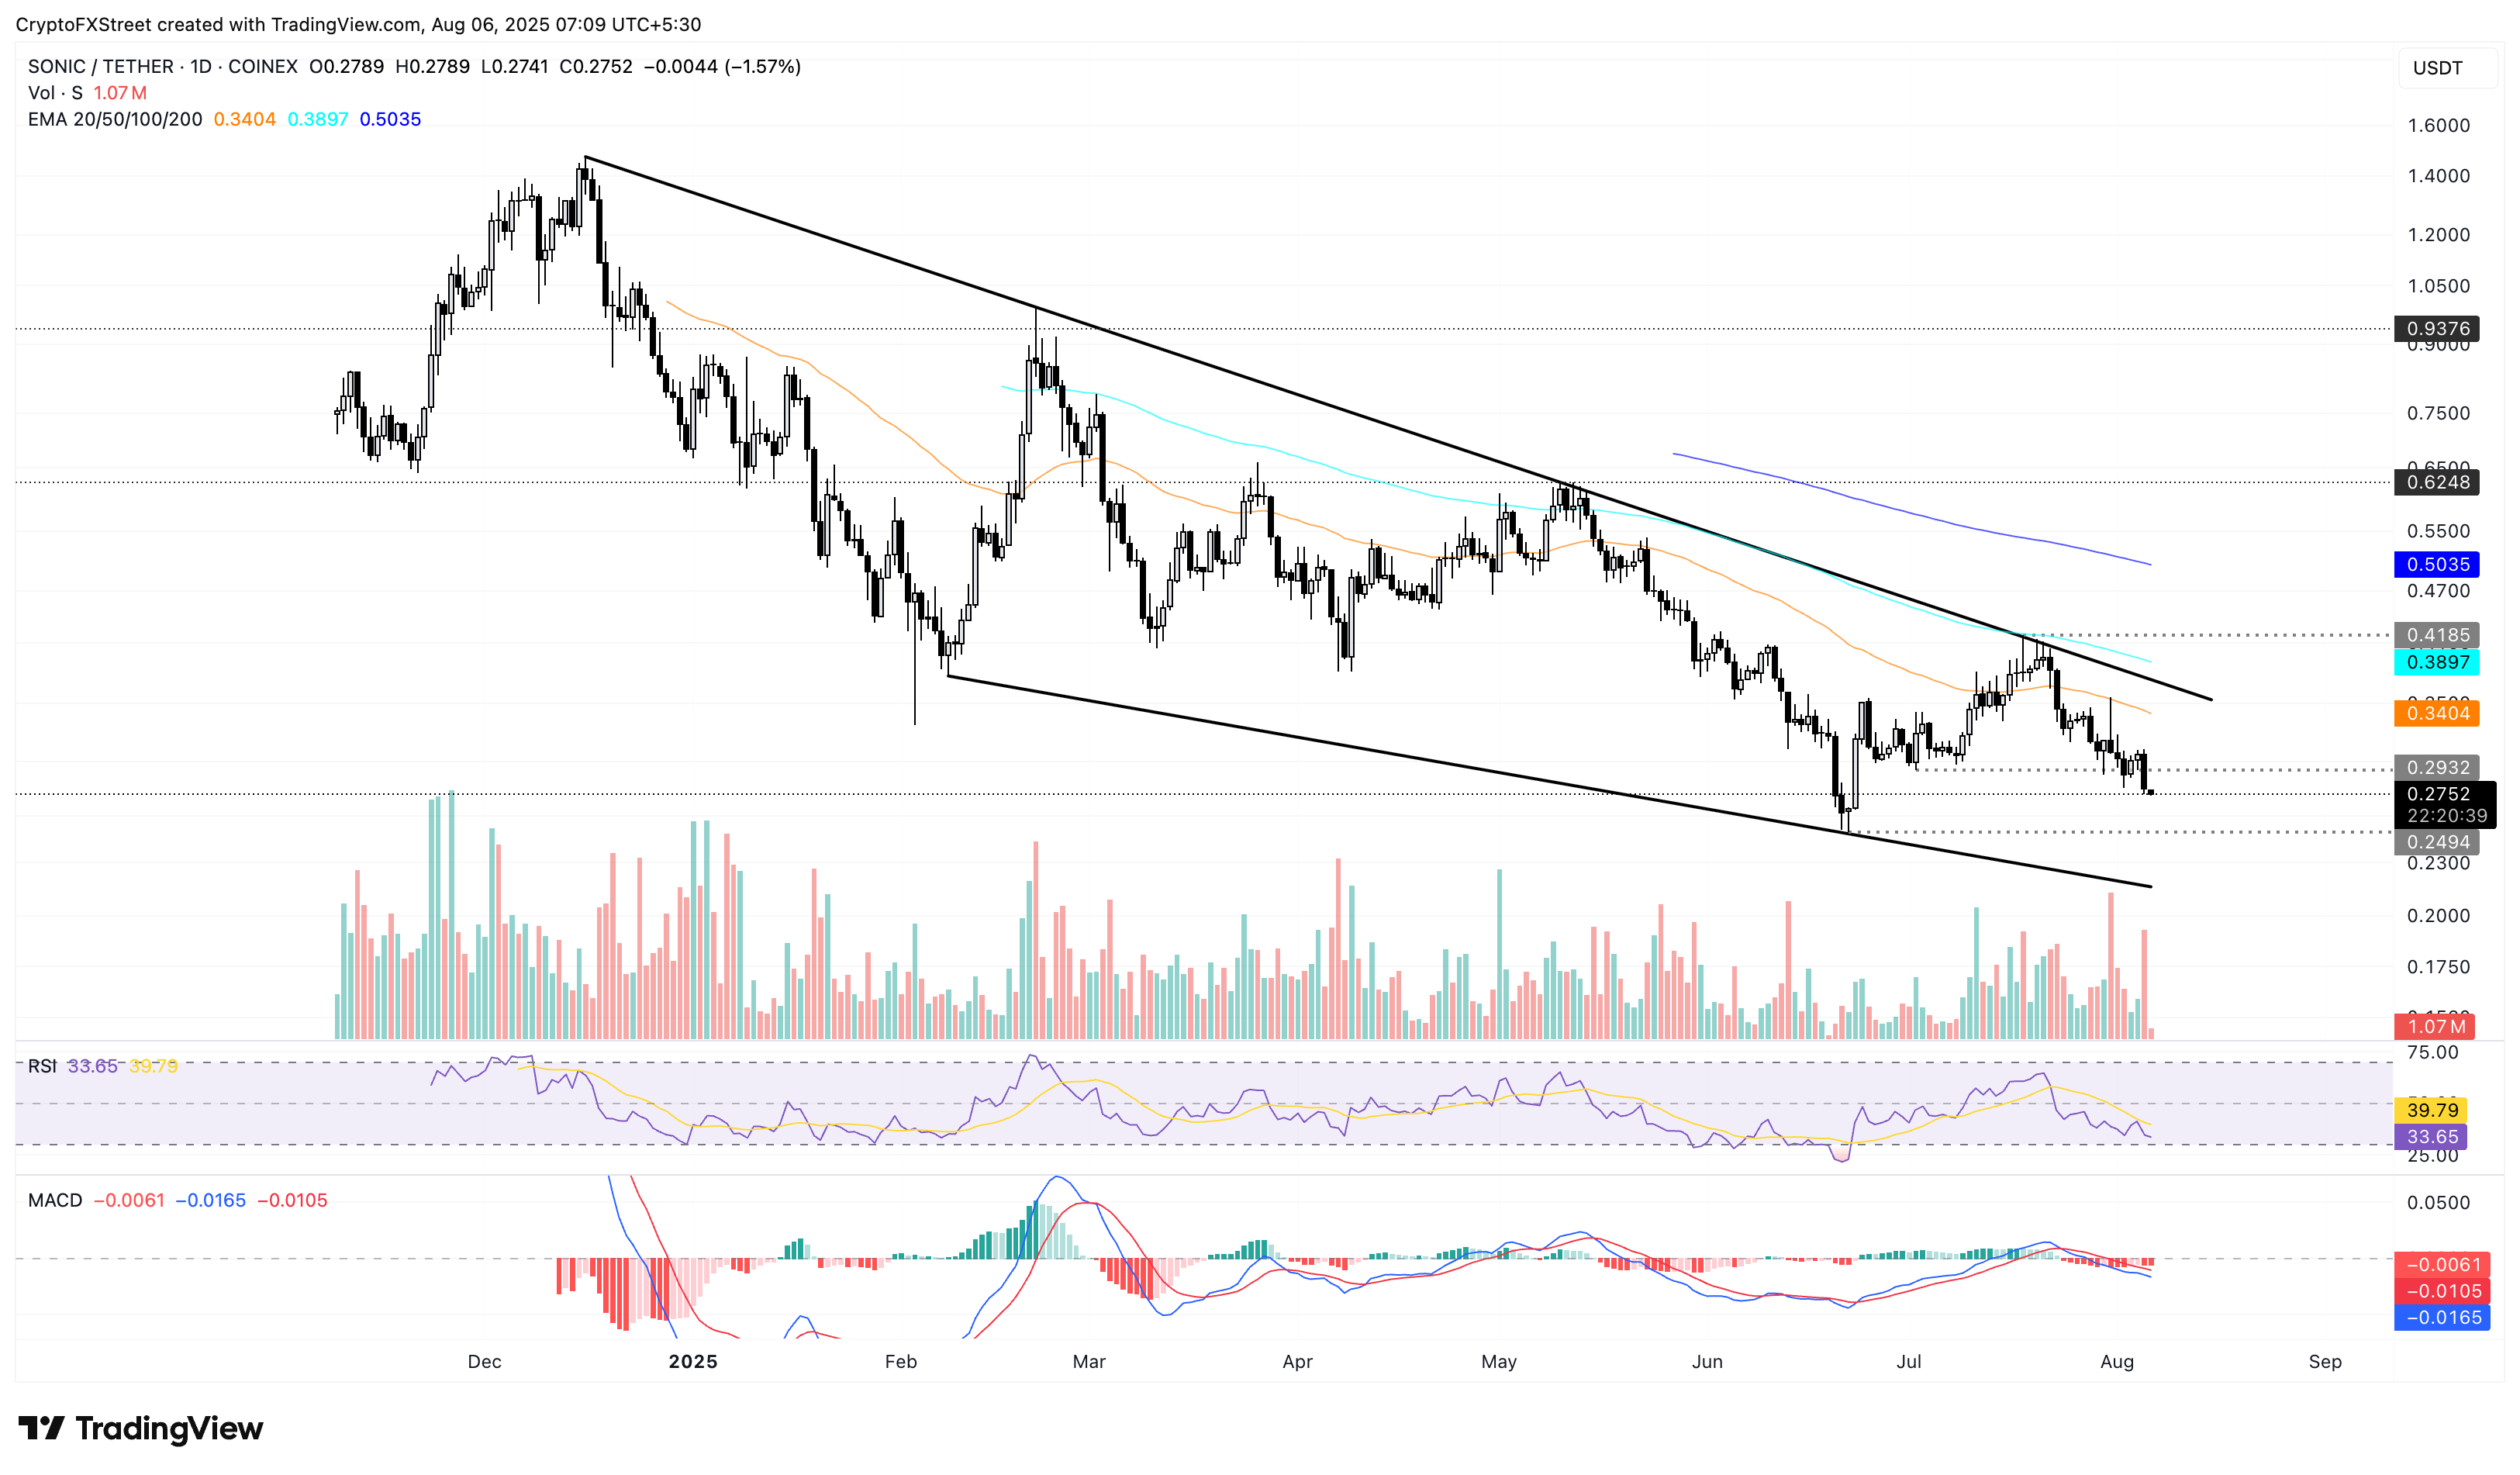
Sonic ticks lower by nearly 2% at the time of writing, extending the 8% loss from Tuesday. The staking platform token declines within a falling wedge pattern on the daily chart (shared below), eyeing the $0.2494 level, last tested on June 22.
Sonic’s downside risk increases as the declining RSI at 33 approaches oversold conditions. The MACD and signal line advance lower in the negative territory, suggesting a rise in bearish momentum.
S/USDT daily price chart.
The lack of an immediate support level for Sonic limits the chances of a bullish turnaround for Sonic. If the token resurfaces above the $0.2932 level, it could extend the rally to the 50-day EMA at $0.3403.
Fartcoin investors on edge as downside risk grows
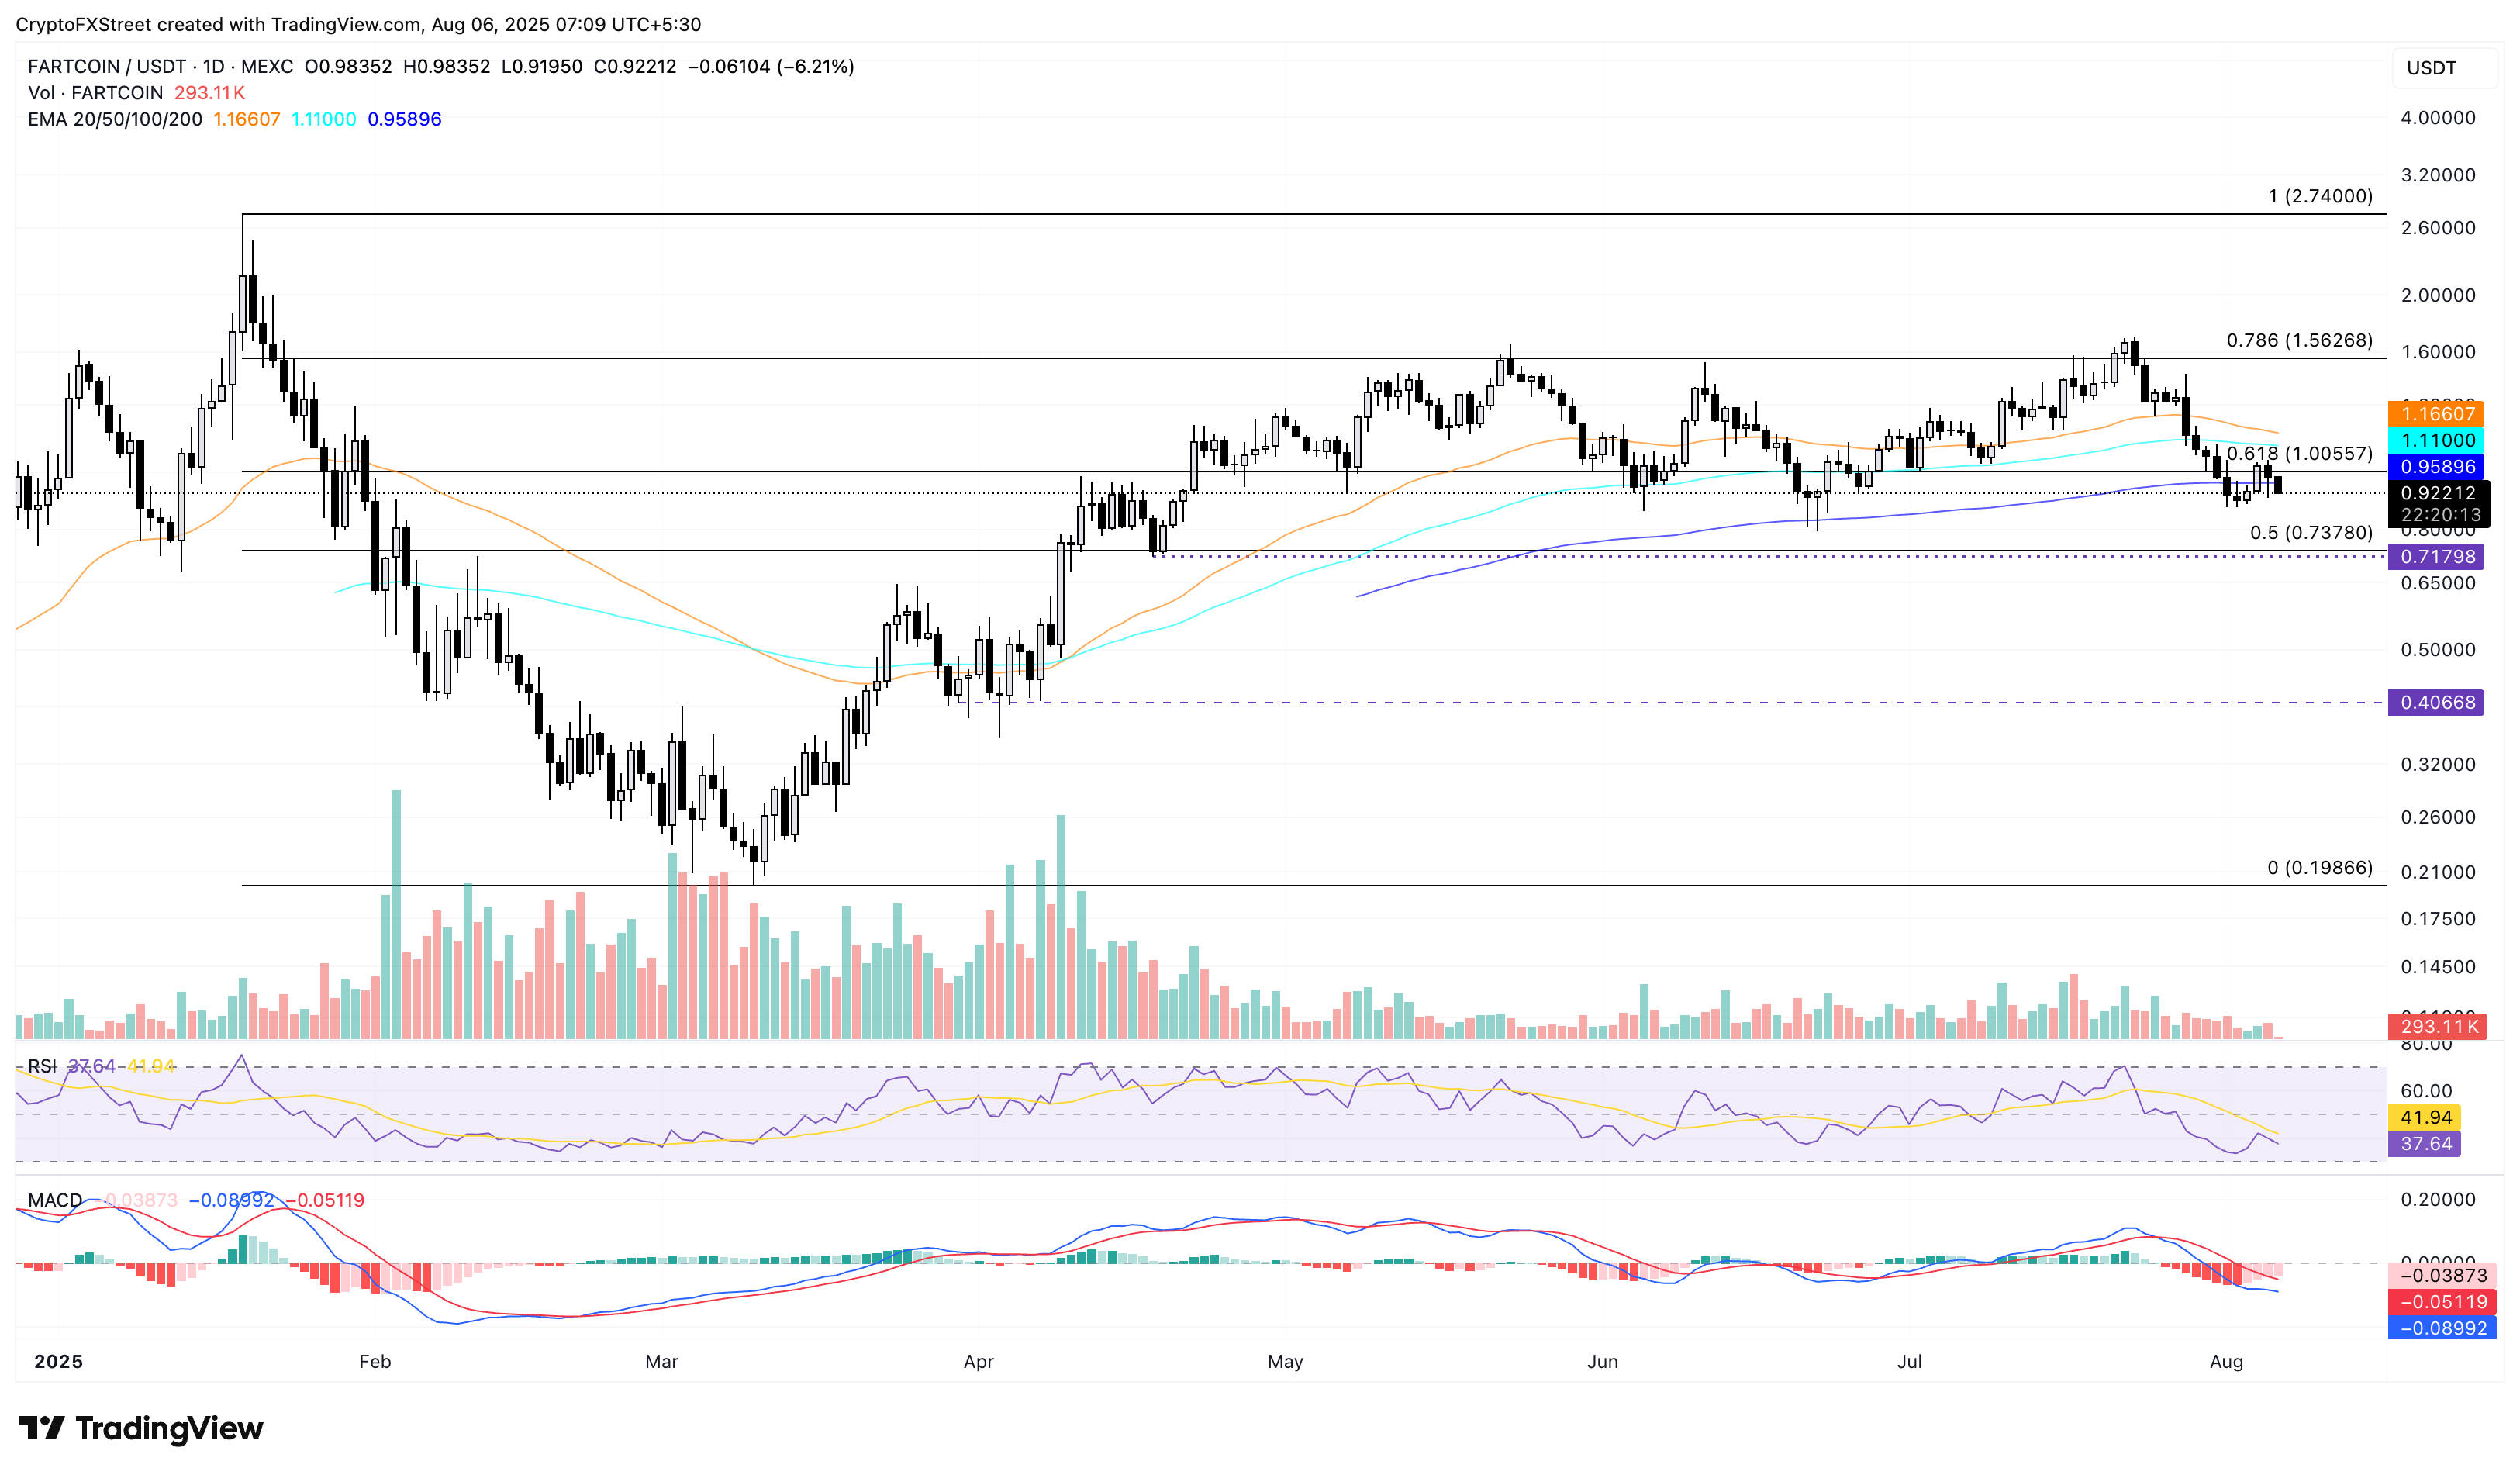
Fartcoin depreciates by over 6% at press time on Wednesday, losing ground after a 4% loss on Tuesday. The declining Solana-based meme coin erases the Sunday gains as it reverses from the 61.8% Fibonacci retracement level at $1.00, drawn from $2.74 on January 19 to $0.19 on March 10.
Fartcoin targets the 50% retracement level at $0.73 as the increasing overhead supply fuels the downfall.
The MACD and signal line in the negative territory move closer to each other, hinting at a potential crossover as bearish momentum cools off. However, as MACD is a lagging indicator, investors must remain cautious.
The RSI reads 37 on the daily chart, suggesting a decline in buying pressure as investors remain on the edge.
FARTCOIN/USDT daily price chart.
On the contrary, a bounce back in Fartcoin could extend the rally to the 50-day EMA at $1.16.
Author

Vishal Dixit
FXStreet
Vishal Dixit holds a B.Sc. in Chemistry from Wilson College but found his true calling in the world of crypto.



