Crypto Gainers: OKB hits record high as ZEC and MORPHO hint at breakout rallies
- OKB hits a record high as the bullish run crosses the $250 milestone.
- ZEC eyes an extension of a falling wedge pattern breakout rally.
- MORPHO inches closer to a crucial resistance amid a Golden Cross.

OKB (OKB) extends the uptrend beyond $250 milestone, securing the top performer spot in the crypto market over the last 24 hours. ZCash (ZEC) and Morpho (MORPHO) emerge as secondary performers with technicals hinting at a potential breakout rally ahead.
OKB advances the bullish streak
OKB edges higher by 7% at press time on Friday, extending the 33% rise from Thursday. The bullish run induced by the 65 million token burn reaches the R3 pivot resistance level at $255, as previously estimated by FXStreet.
A decisive close above this level could boost the rally to the R4 pivot level at $311.
The momentum indicators maintain a bullish bias on the same chart as the bull run seems unstoppable. The Relative Strength Index (RSI) is at 89, maintaining a steady move in the overbought zone, indicating unfazed buying pressure at near-saturated levels.
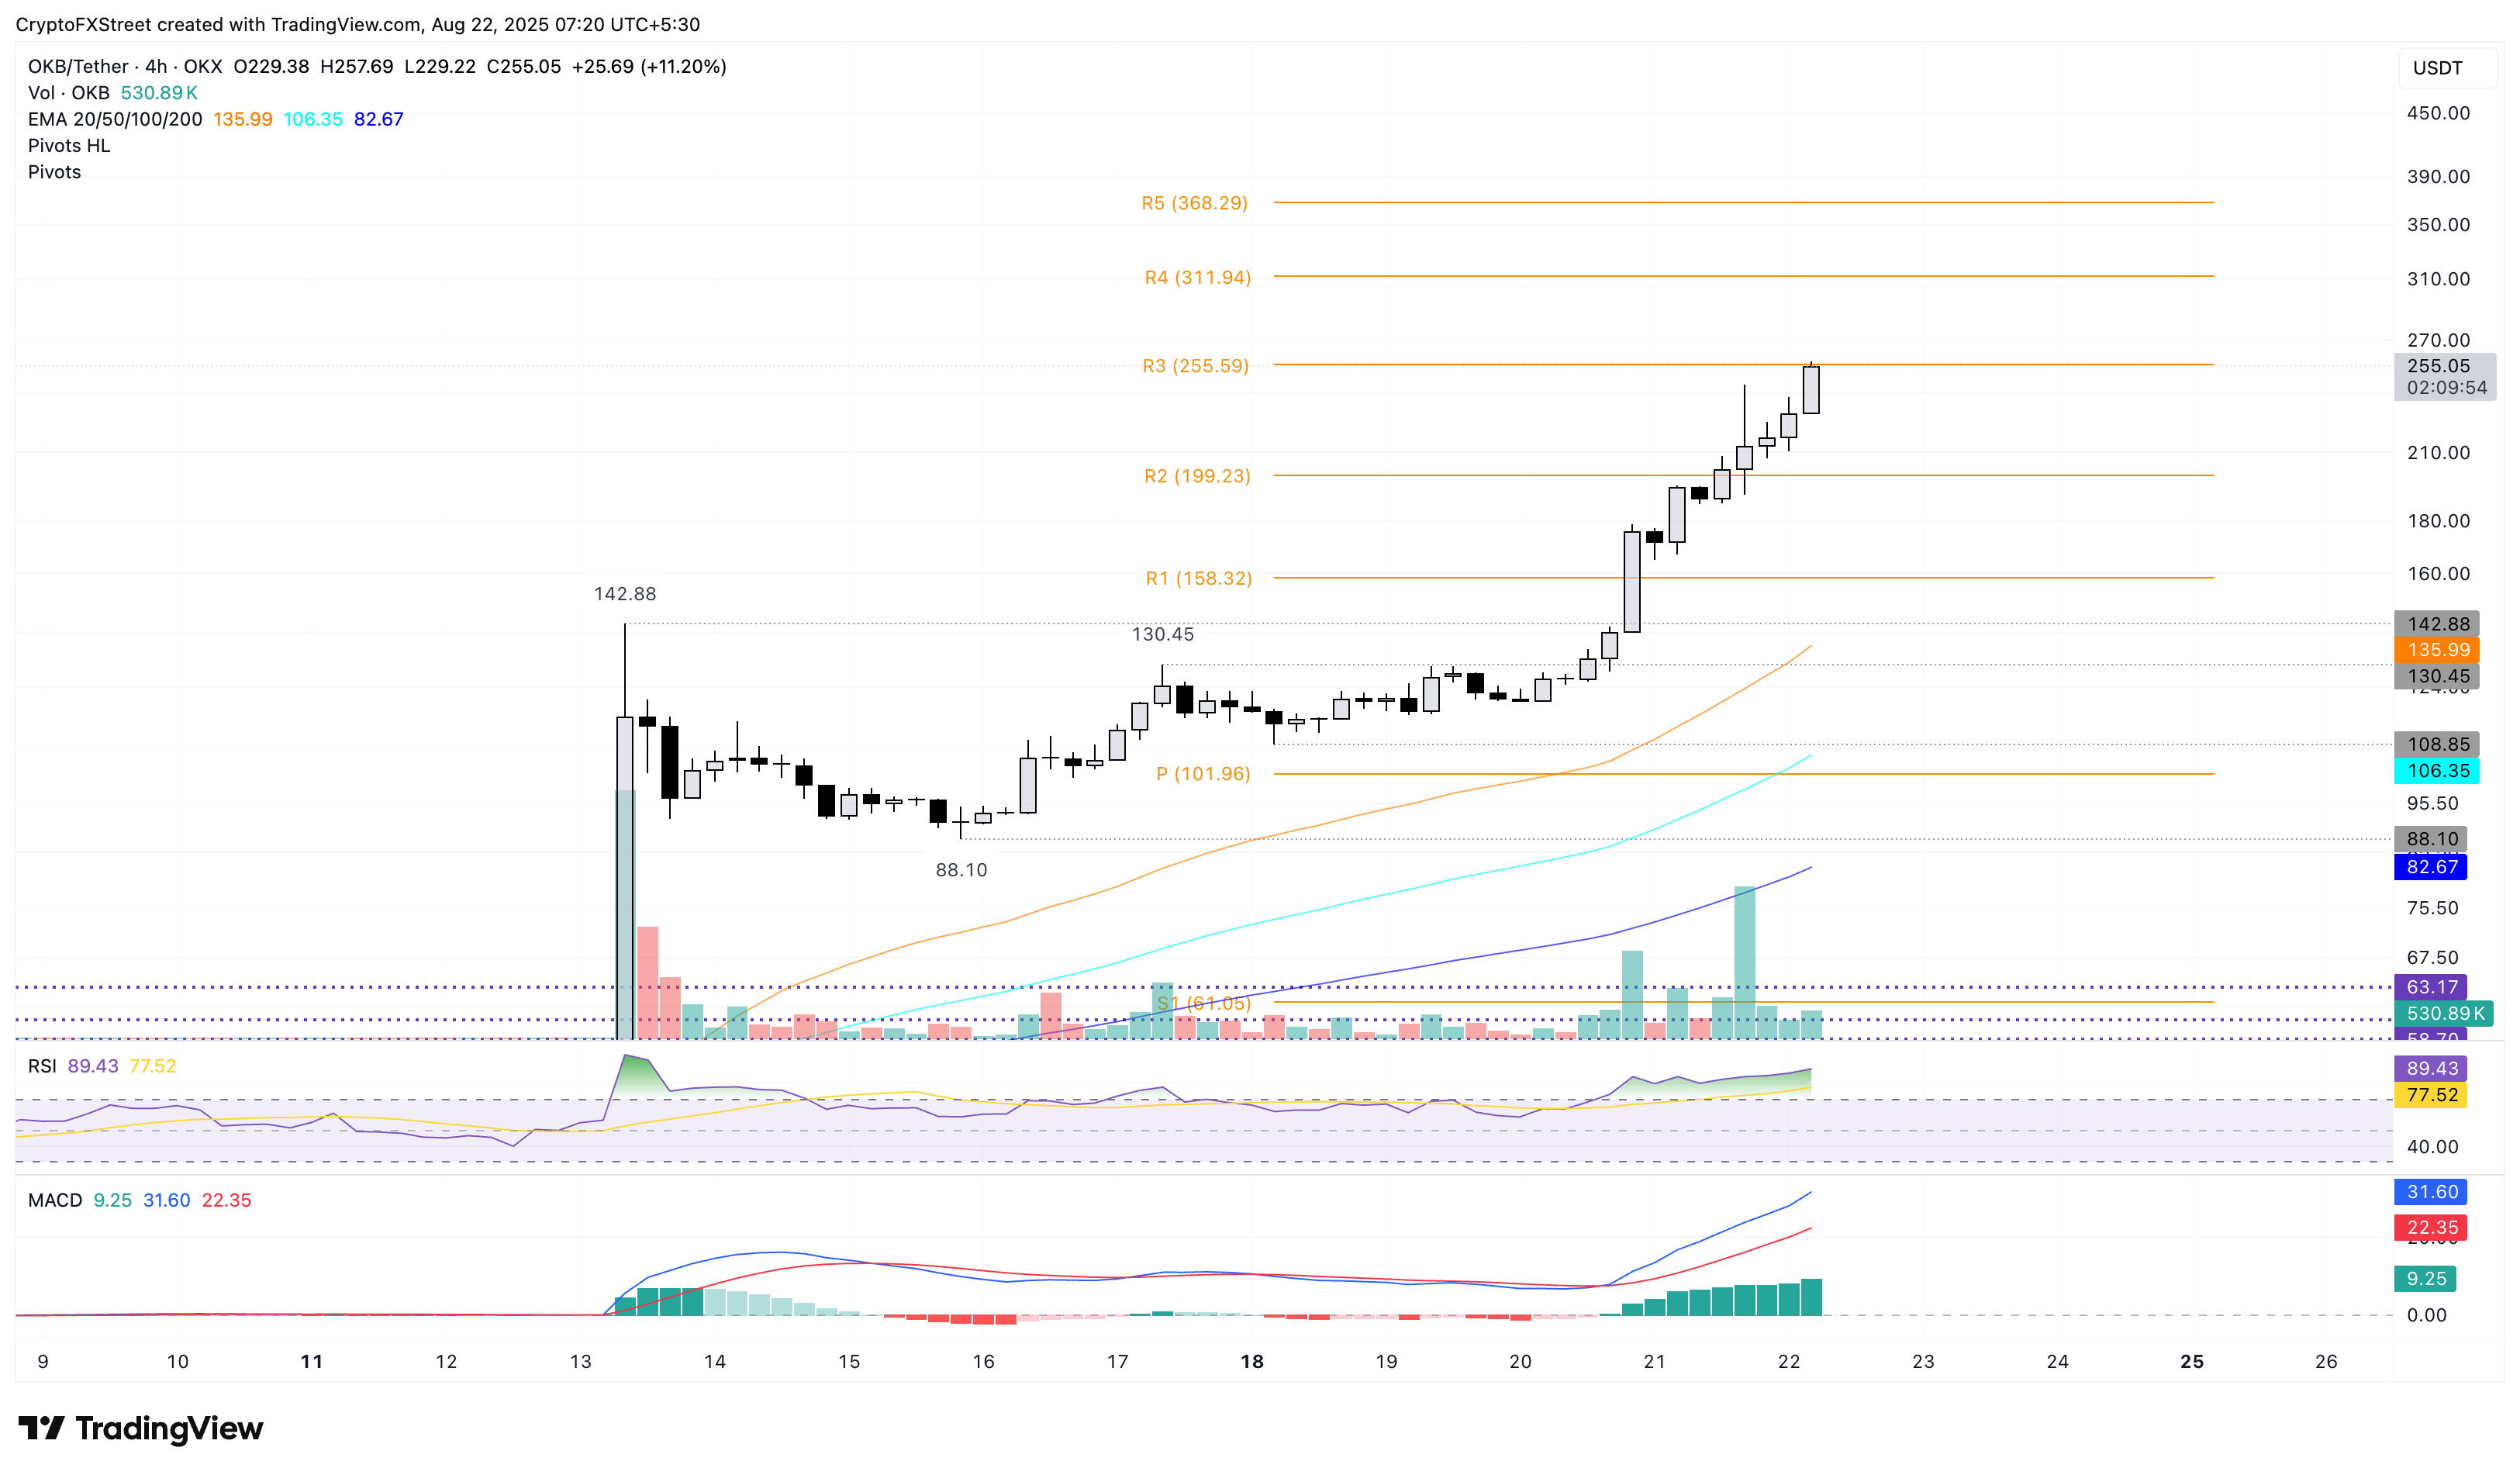
OKB/USDT daily price chart.
Looking down, a potential pullback in the bull run from the R3 pivot level at $255 could retest the $200 psychological milestone.
ZEC awaits breakout rally gains
ZCash edges higher at the time of writing on Friday, preparing for potentially the third consecutive bullish candle, following the 9% gains from Thursday. The bullish recovery from the previous day marked the breakout of a falling wedge pattern on the daily chart (shared below).
An upside continuation of the privacy coin’s breakout run could target the 50% retracement level at $46.66, which is derived from the range between $74.59 from December 2 and $29.19 from March 11.
The MACD crossed above its signal line on Wednesday, signaling a buy opportunity as bullish momentum resurfaces. Additionally, the RSI reads 60, pointing upwards, indicating that buying pressure is on the rise with further room for growth before reaching overbought conditions.
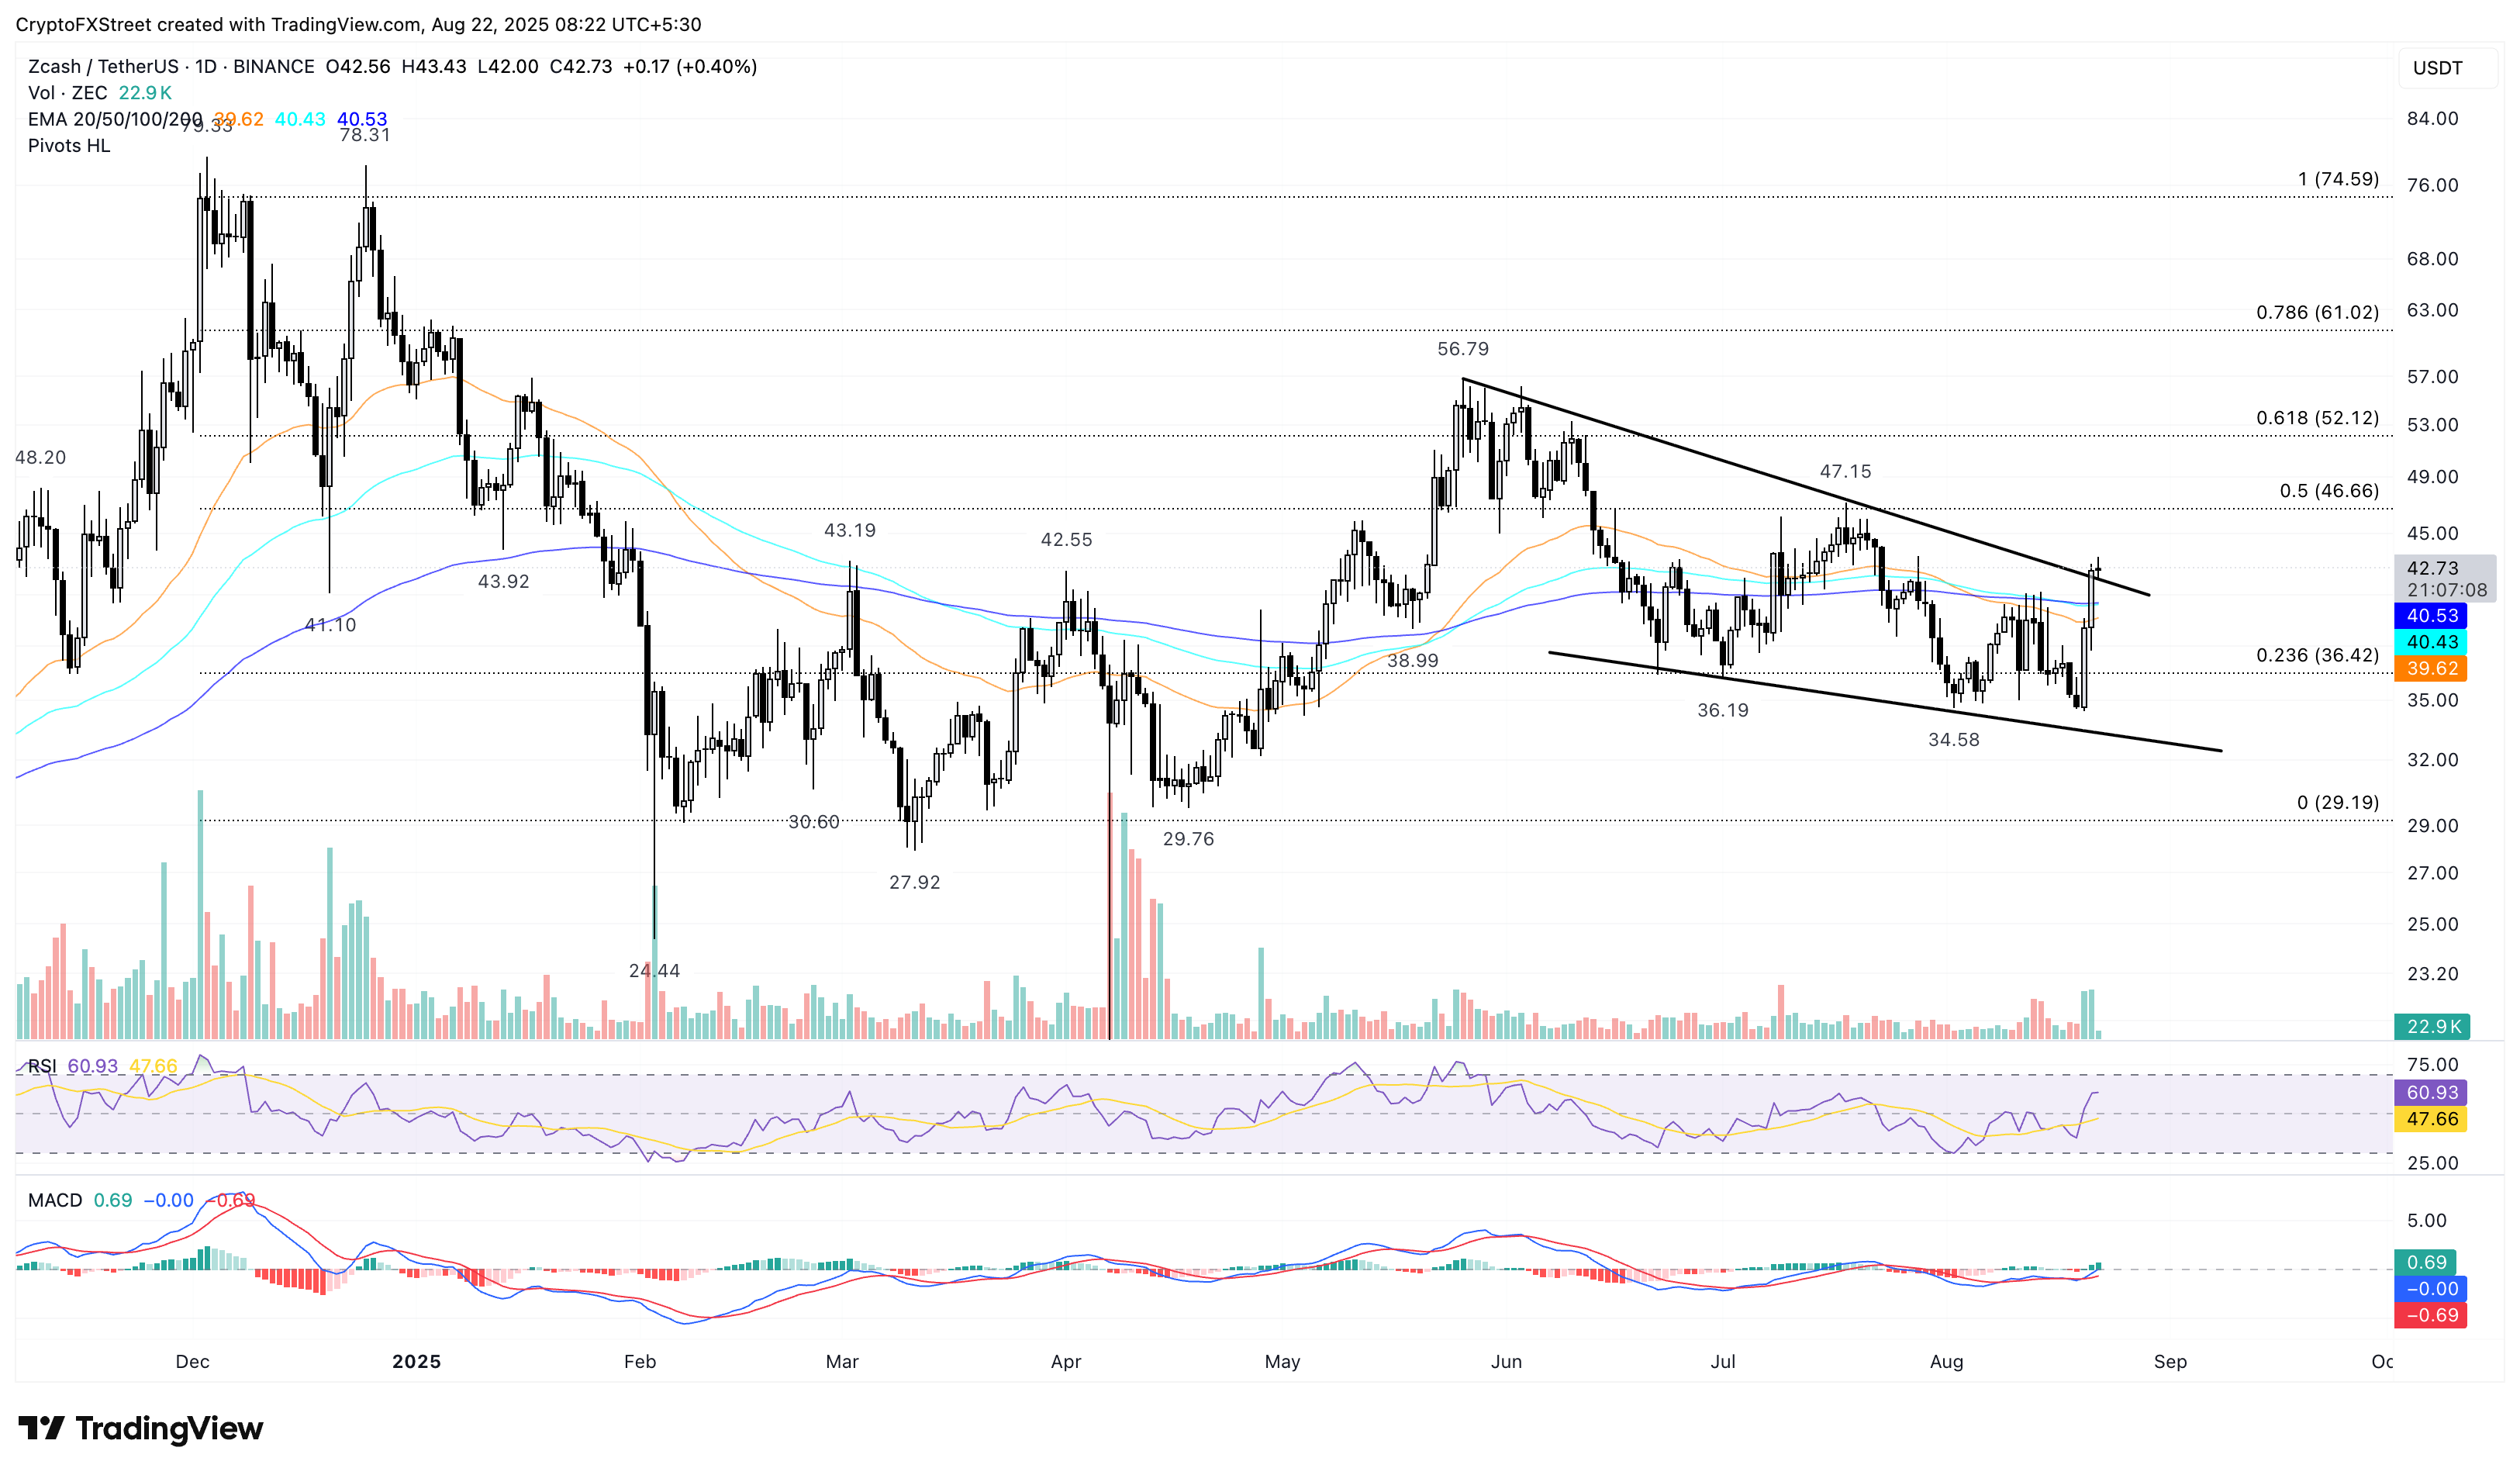
ZEC/USDT daily price chart.
On the other hand, a potential pullback below the 200-day Exponential Moving Average (EMA) at $40.53 would invalidate the pattern breakout, potentially extending the decline to the lower boundary line at $33.36.
Morpho eyes further gains amid Golden Cross
Morpho extends the uptrend for the third consecutive day, crossing above the 61.8% Fibonacci retracement at $2.24, which is extended between the January 18 high of $4.18 and the $0.81 low of April 16.
The recovery run inches closer to the $2.45 resistance level marked by the February 27 high. A decisive close above this level could extend the rally to the 78.6% Fibonacci level at $2.95.
A Golden Cross between the 50- and 200-day EMA signals a buy opportunity for sidelined investors as the short-term trend gains momentum.
The MACD and its signal line uphold a positive trend above the zero line after a crossover on Wednesday, indicating a recovery in the bullish momentum. The RSI is at 65, inching closer to the overbought boundary, indicating a fresh wave of risk-on sentiment among investors.
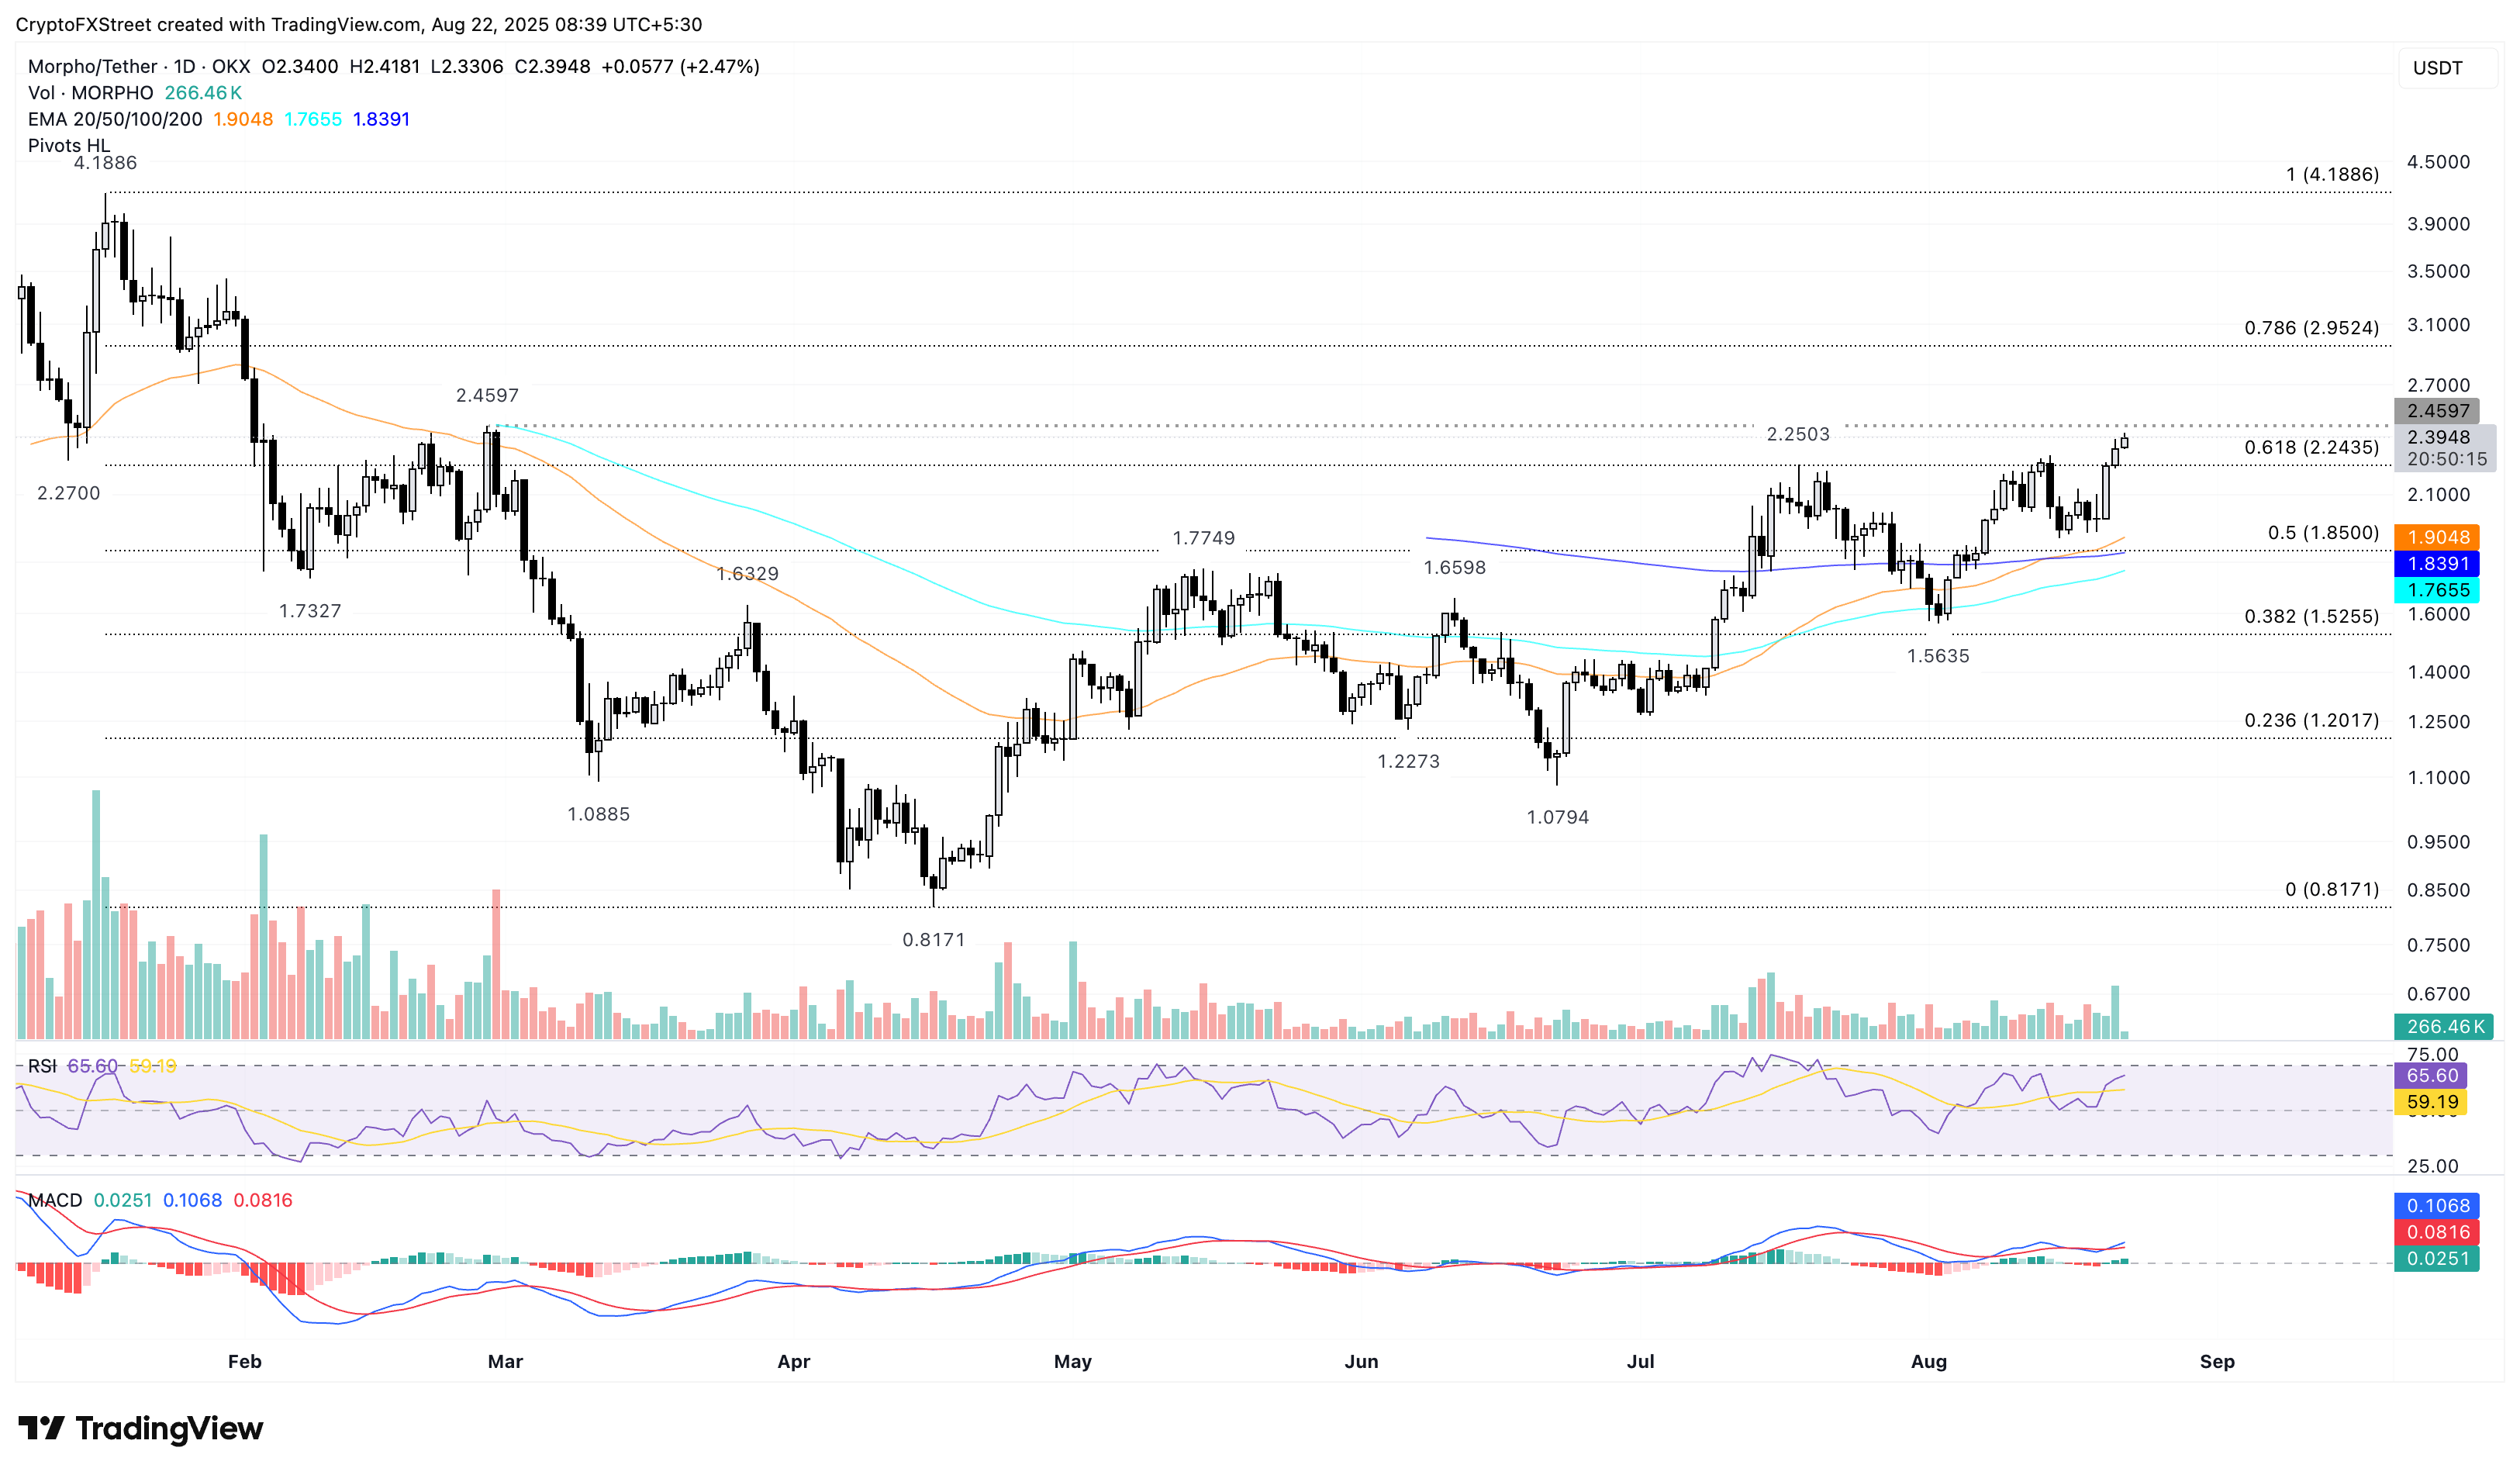
MORPHO/USDT daily price chart.
On the flip side, if MORPHO drops below the 61.8% Fibonacci level at $2.24, it could retest the 50-day EMA at $1.90.
Author

Vishal Dixit
FXStreet
Vishal Dixit holds a B.Sc. in Chemistry from Wilson College but found his true calling in the world of crypto.


