Crypto All-Time High Season: OKB hits record high as Arbitrum, Raydium follow
- OKB marks a triple-digit surge on Wednesday, hitting a record high.
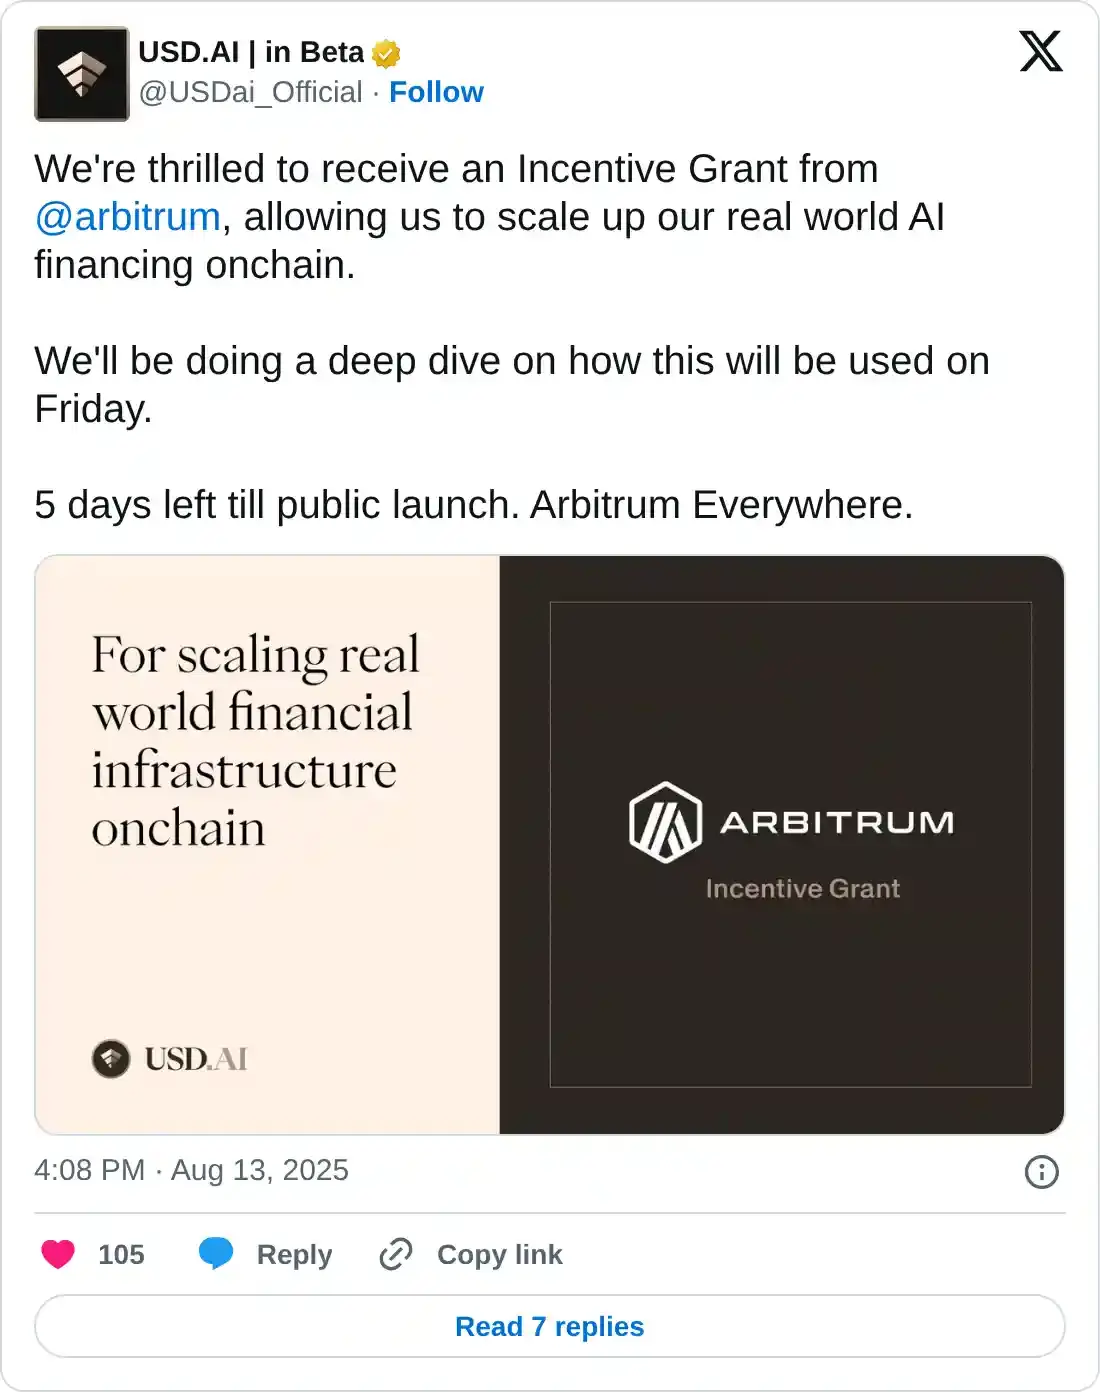
- Arbitrum ticks lower after a 19% jump the previous day on the back of an investment grant issued to USDai.
- Raydium extends the uptrend by over 5% on Thursday, eyeing the $4.00 milestone.

OKB (OKB), Arbitrum (ARB), and Raydium (RAY) rank as top performers over the last 24 hours as the cryptocurrency market hits an all-time high of over $4.15 trillion on Thursday. The technical outlook and the broader market sentiment suggest further gains.
Risk-on sentiment among investors intensifies as Bitcoin (BTC) reaches a new record high of over $124,000, while Ethereum (ETH) inches closer to its all-time high of $4,868.
OKB extends gains after 65 million token burn
OKB token reached a record high of $142 before cooling off to $105 on Wednesday, underpinned by around 65 million token burn and other key network changes. The event-driven hype surrounding OKB extends the uptrend by over 4% at press time on Thursday.
To extend the rally, OKB should surpass the R3 pivot level at $122, making the R4 pivot level at $146 the next potential target.
OKB’s sudden surge reflects a bullish imbalance in the momentum indicators. On the daily chart, the Moving Average Convergence Divergence (MACD) and its signal line surge with massive green histograms, indicating a surge of bullish momentum. The Relative Strength Index (RSI) reads 94 in the overbought zone, indicating a reversal risk.
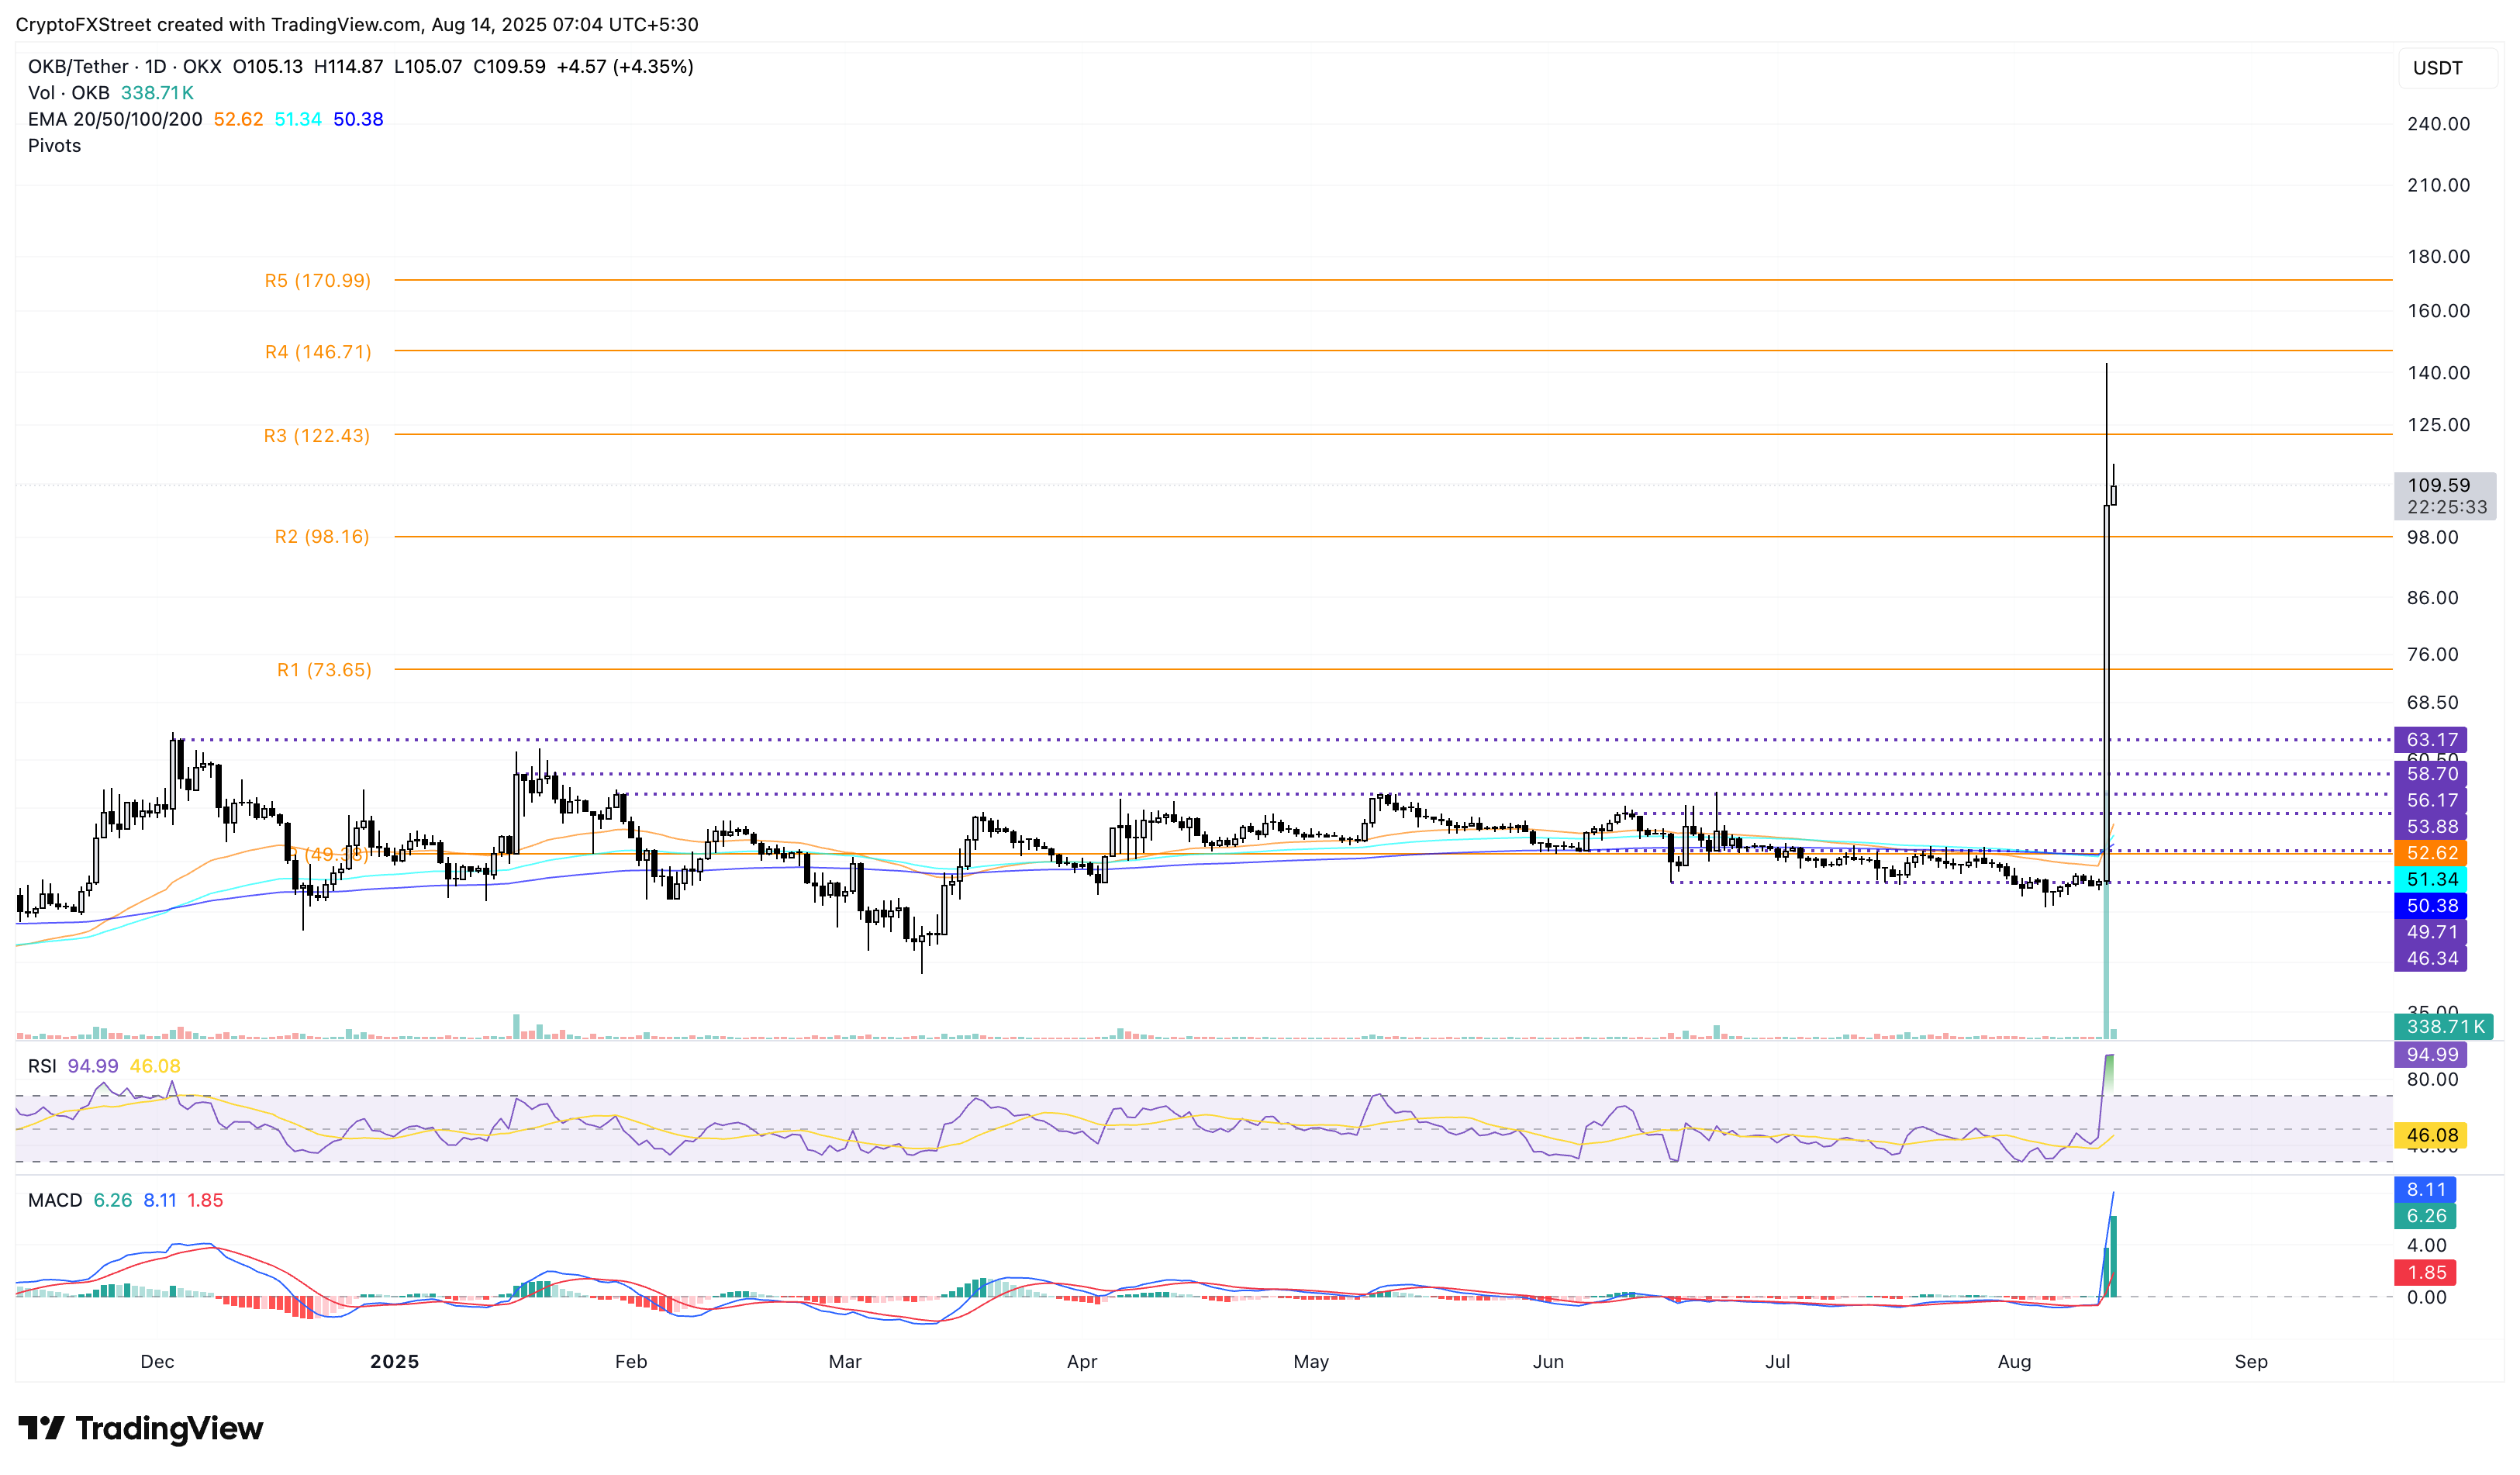
OKB/USDT daily price chart.
Looking down, a reversal in the day could cause OKB to decline to the R2 pivot level at $98.
Arbitrum stands at a crossroads amid Golden Cross chances
Arbitrum edges lower by 2% at the time of writing on Thursday, following the 19.60% jump from the previous day. Still, the uptrend has marked a decisive close above the $0.5050 key resistance and recorded the highest price since February 2.
The bullish trend aligns with the recent announcement of Arbitrum providing an investment grant to USDai to scale up its real-world AI financing on-chain.
ARB could extend the uptrend if the short-term rally holds steady, which could drive the 50-day Exponential Moving Average (EMA) to cross above the 200-day EMA for a Golden Cross. As the gap between the two EMAs declines, investors could consider the crossover a buy signal as the short-term trend outpaces the longer trend.
Looking up, the $0.6676 resistance, last tested on January 31, could be the next key resistance.
The momentum indicators maintain a bullish inclination as the uptrending RSI at 68 approaches the overbought boundary, indicating increased buying pressure. Moreover, the MACD indicator displays a steady rise in green histogram bars, accompanied by uptrending average lines, which suggests increasing bullish momentum.
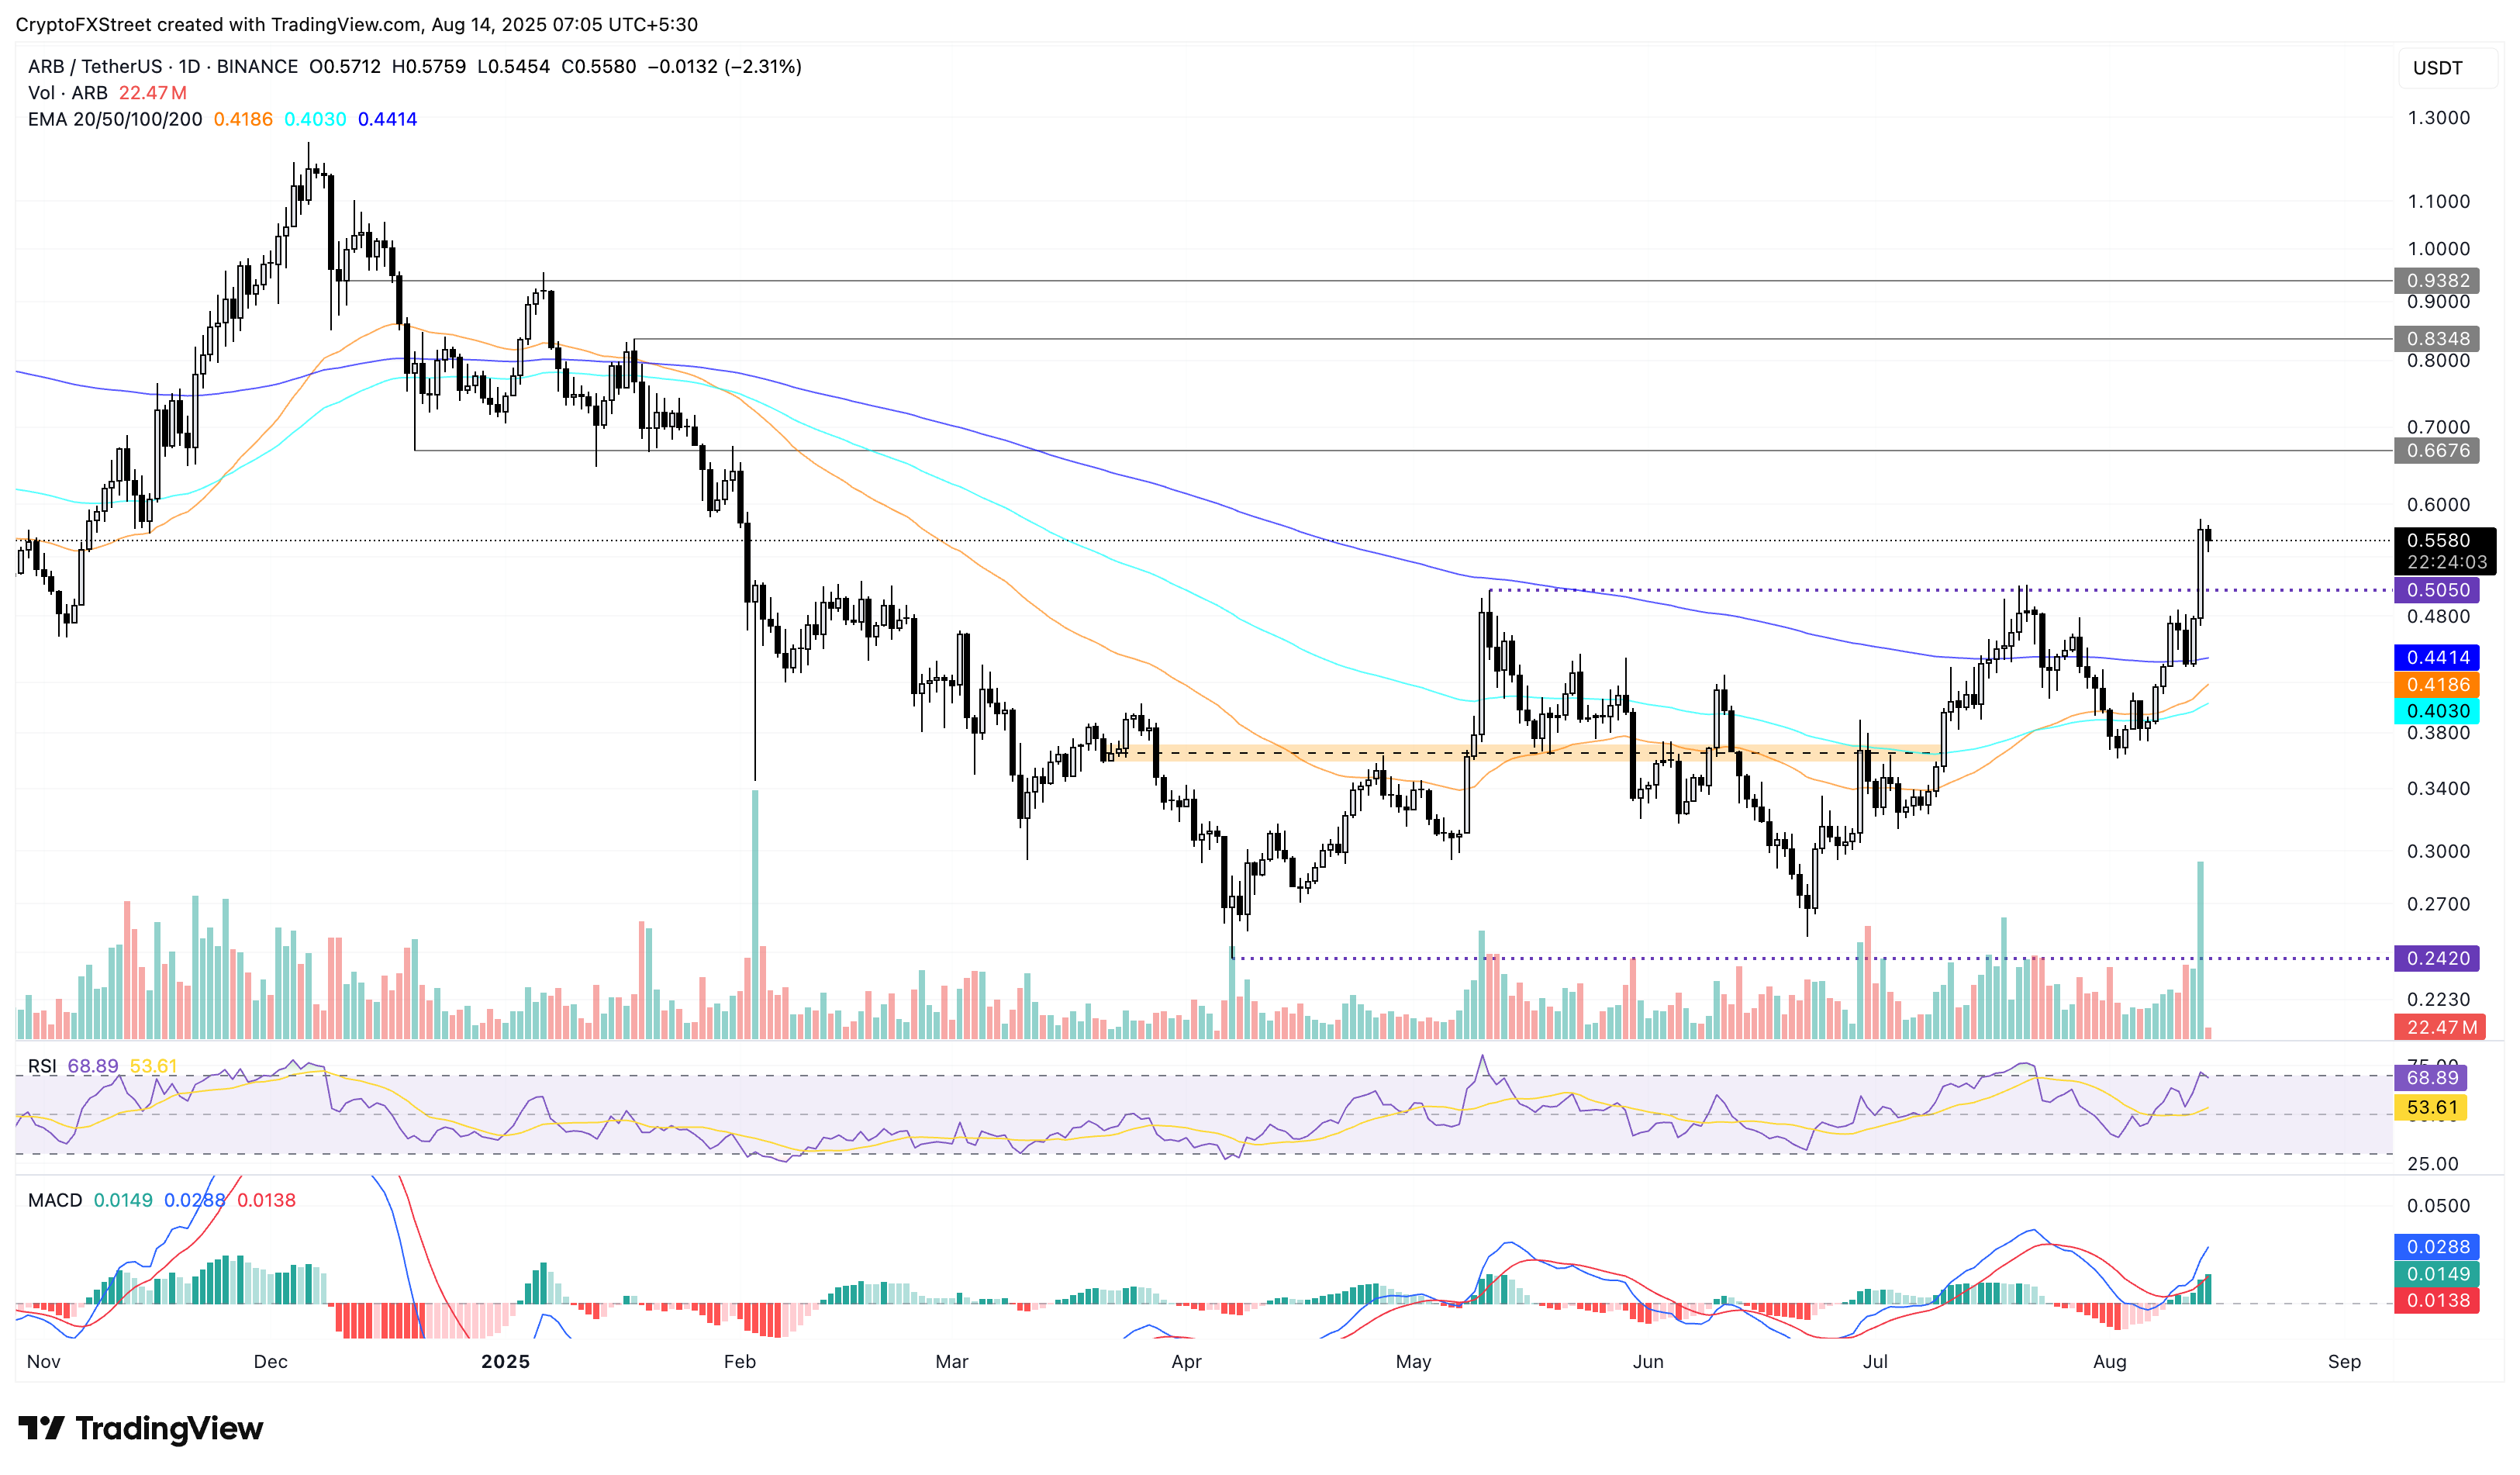
ARB/USDT daily price chart.
On the contrary, an extension of the intraday pullback could retest the $0.5050 resistance-turned-support level.
Raydium targets $4.00 breakout
Raydium extends the uptrend by nearly 6% at press time on Thursday after the 14% surge from Wednesday. The Solana-based decentralized exchange token nears the $4.00 milestone, recording its highest price since February 24.
A decisive close above the $4.00 mark could extend the rally to $4.60, last tested as support on February 18.
Raydium’s Total Value Locked (TVL) stands at $2.269 billion, up from $2.070 billion the previous day, suggesting increased network activity as users deposit large sums of digital assets.
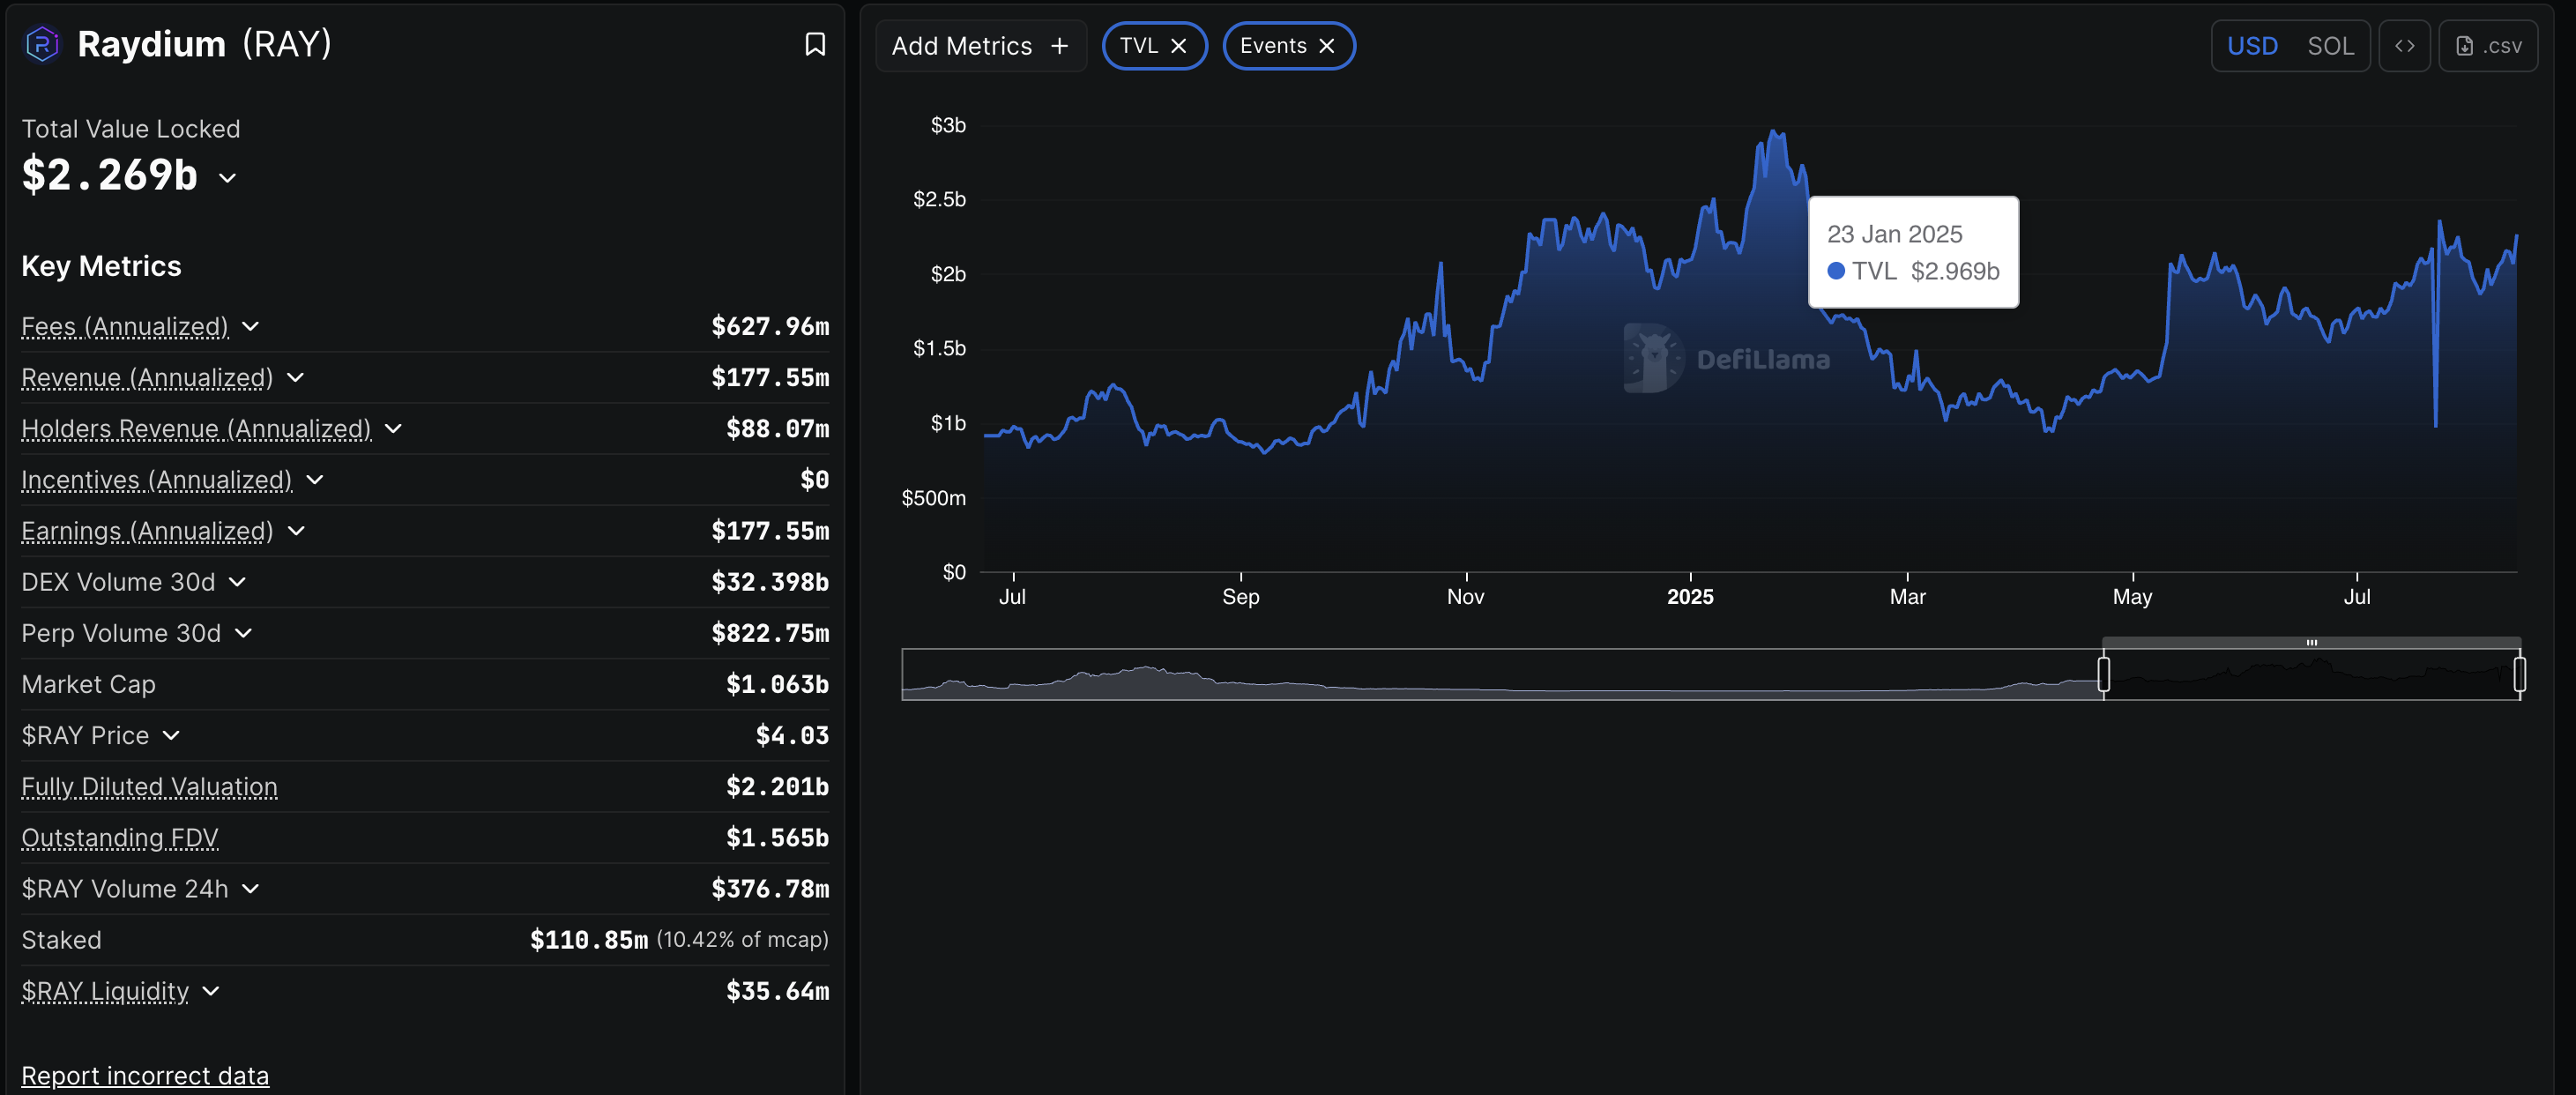
Raydium TVL. Source: DeFiLlama
The MACD and its signal line maintain an uptrend, indicating bullish momentum on the rise. Additionally, the RSI line at 71, pointing upwards, suggests heightened buying pressure.
Similar to ARB, the 50- and 200-day EMAs are on the verge of a Golden Cross, which could be a potential buy signal for sidelined investors.
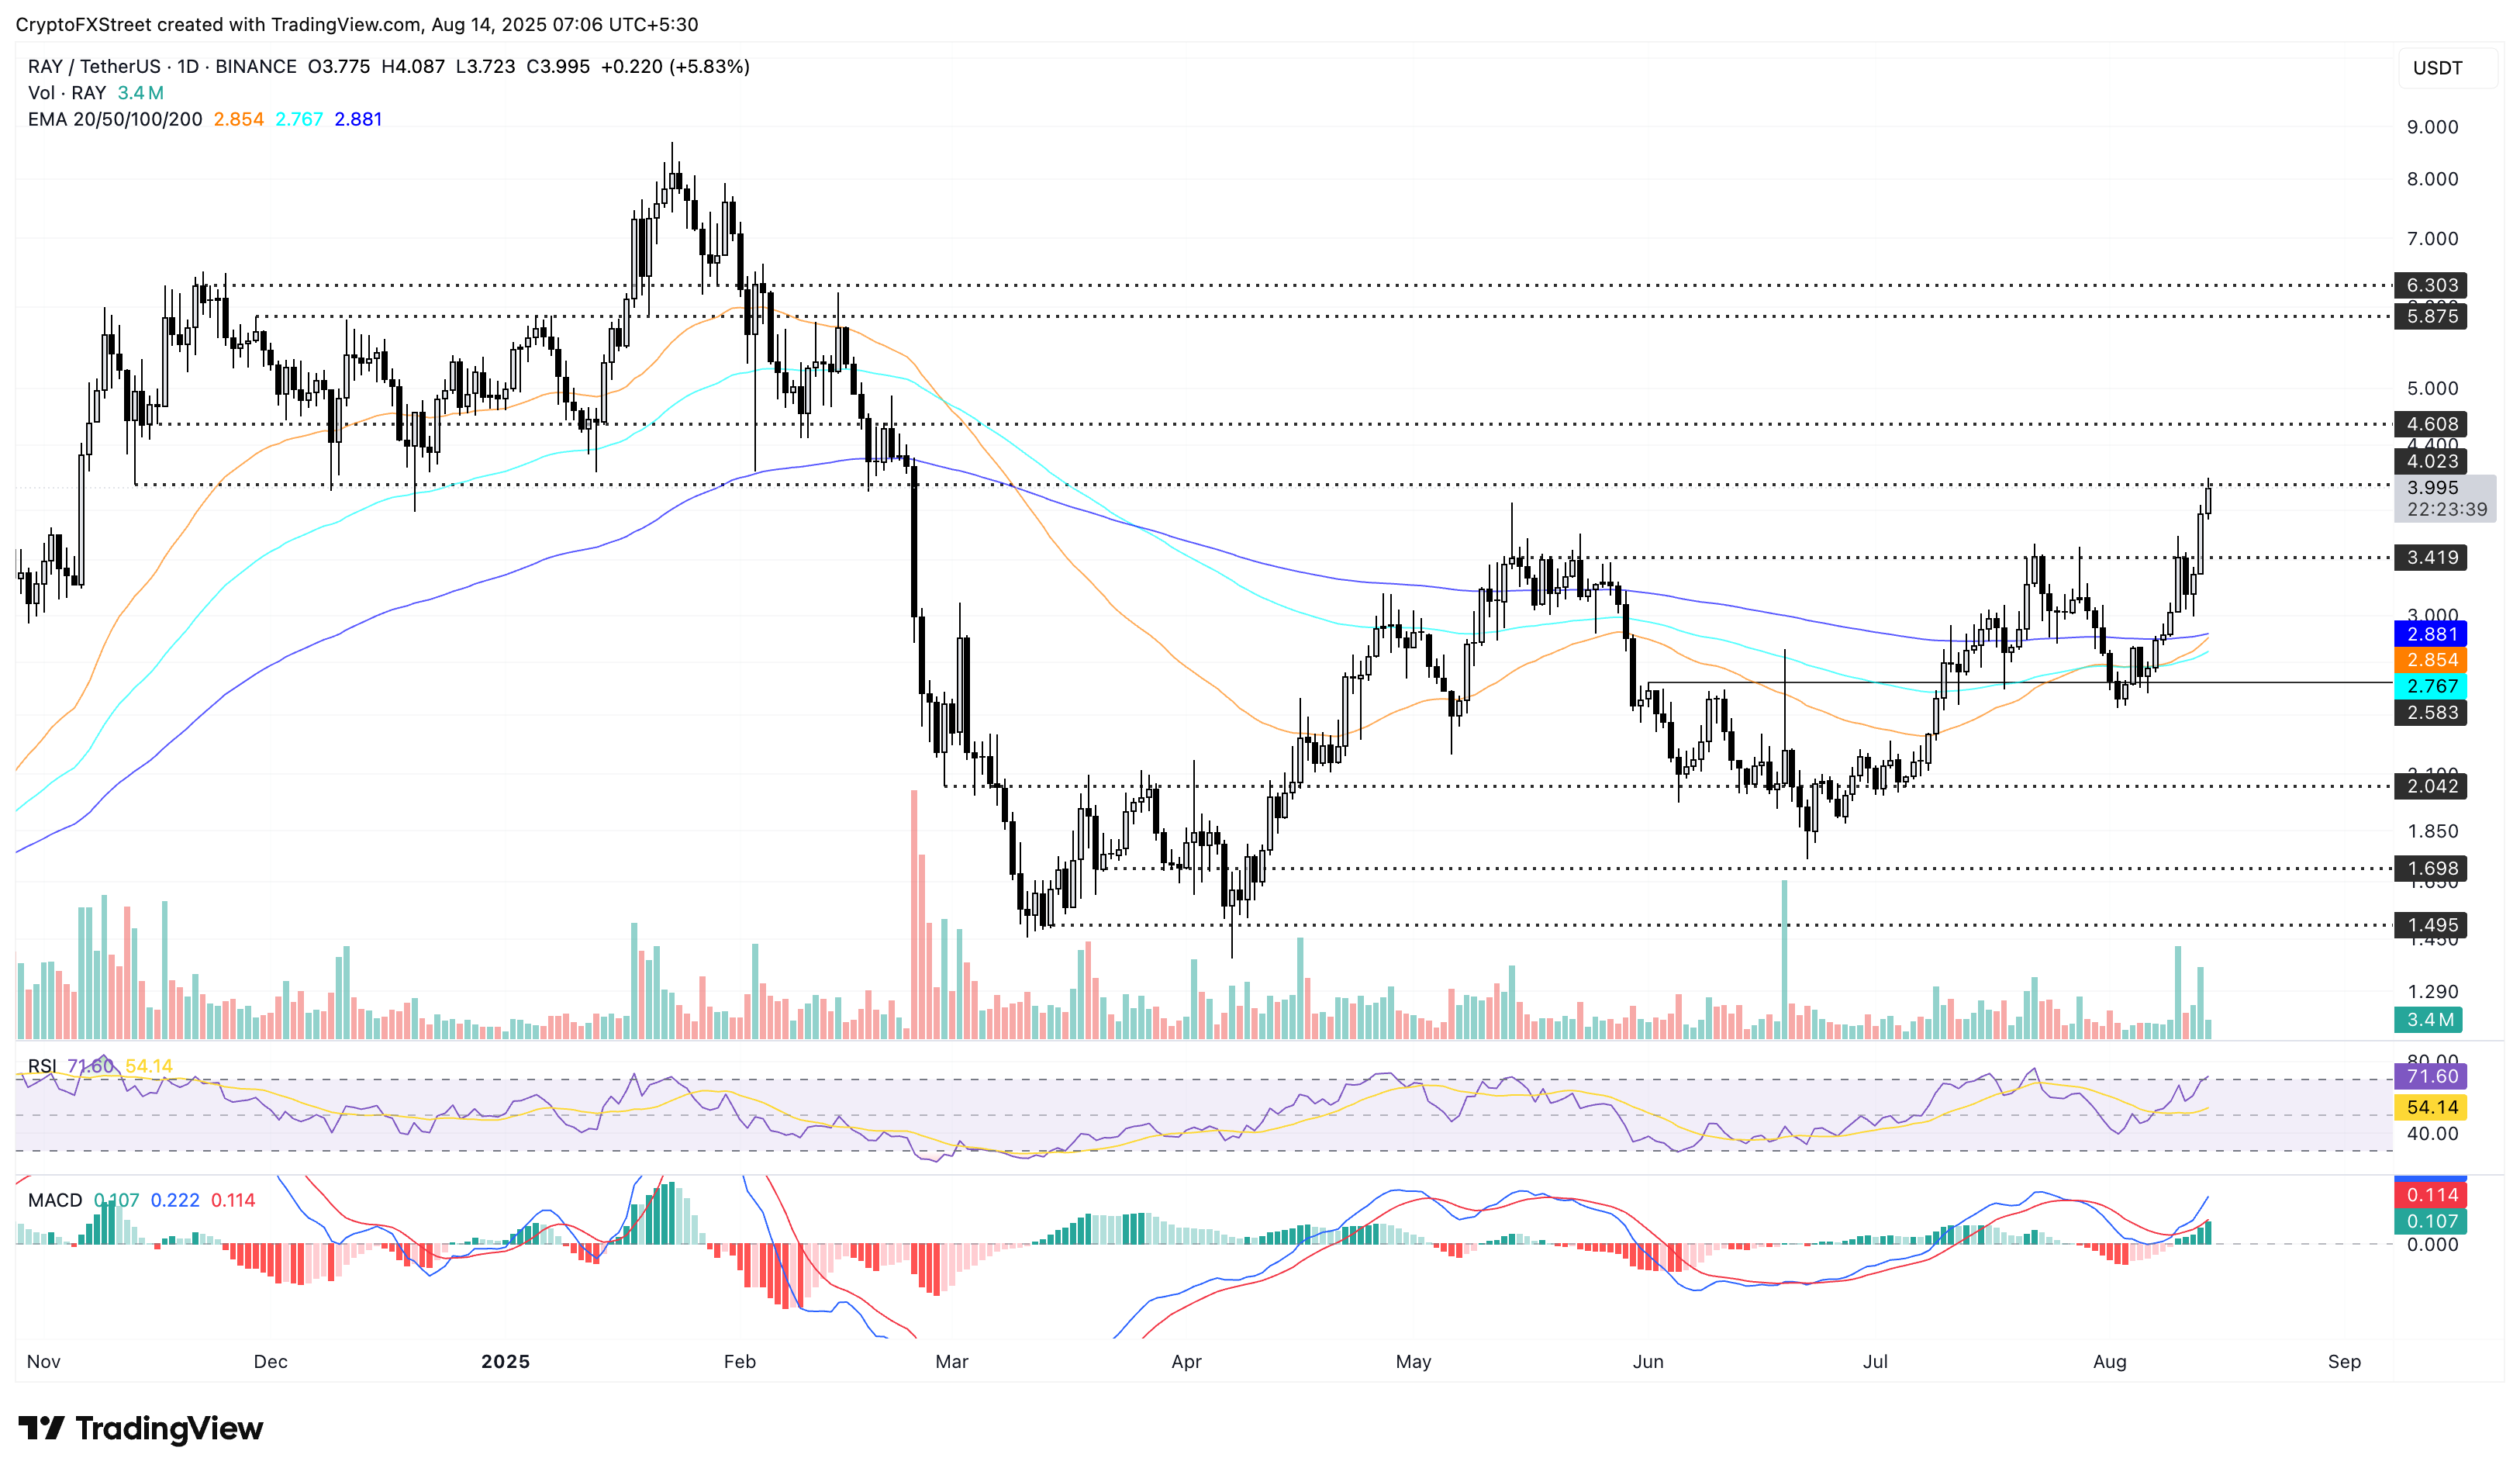
RAY/USDT daily price chart.
Looking down, if RAY reverses from the $4.00 mark, it could retest the $3.41 level, marked by the May 14 close.
Author

Vishal Dixit
FXStreet
Vishal Dixit holds a B.Sc. in Chemistry from Wilson College but found his true calling in the world of crypto.


