Crypto Gainers: OKB leads crypto rally, Conflux and GateToken follow
- OKB adds 9% gains, extending the 42% run from Wednesday,
- CFX advances a 12% jump from the 50-day EMA.
- GT surpasses a crucial resistance, with bulls targeting the $20 milestone.

OKB (OKB) leads the market recovery with over 50% gains in the last 24 hours, followed by Conflux (CFX) and GateToken (GT), securing double-digit gains. The mood of the broader cryptocurrency market is uplifted as it recovers from the initial hit by the release of the Federal Reserve's meeting minutes.
OKB hits a record high, bulls aim for breakout to $200
OKB edges higher by 9% at press time on Thursday, extending the 42% gains from the previous day. The altcoin reached a new all-time high $195, with bulls targeting the $200 milestone.
A decisive close above this psychological level would mark the R2 pivot level breakout, which could further extend the rally to the R3 pivot level at $255.
The momentum indicators suggest a high-risk-on phase on the 4-hour chart. The Moving Average Convergence Divergence (MACD) indicator and its signal line exhibit a near-vertical rise, indicating a surge in bullish momentum.
Additionally, the Relative Strength Index (RSI) reads 84 on the same chart, indicating a steady rise in the overbought zone, which suggests heightened demand. However, the conditions warn of a profit-booking risk which could result in a pullback.
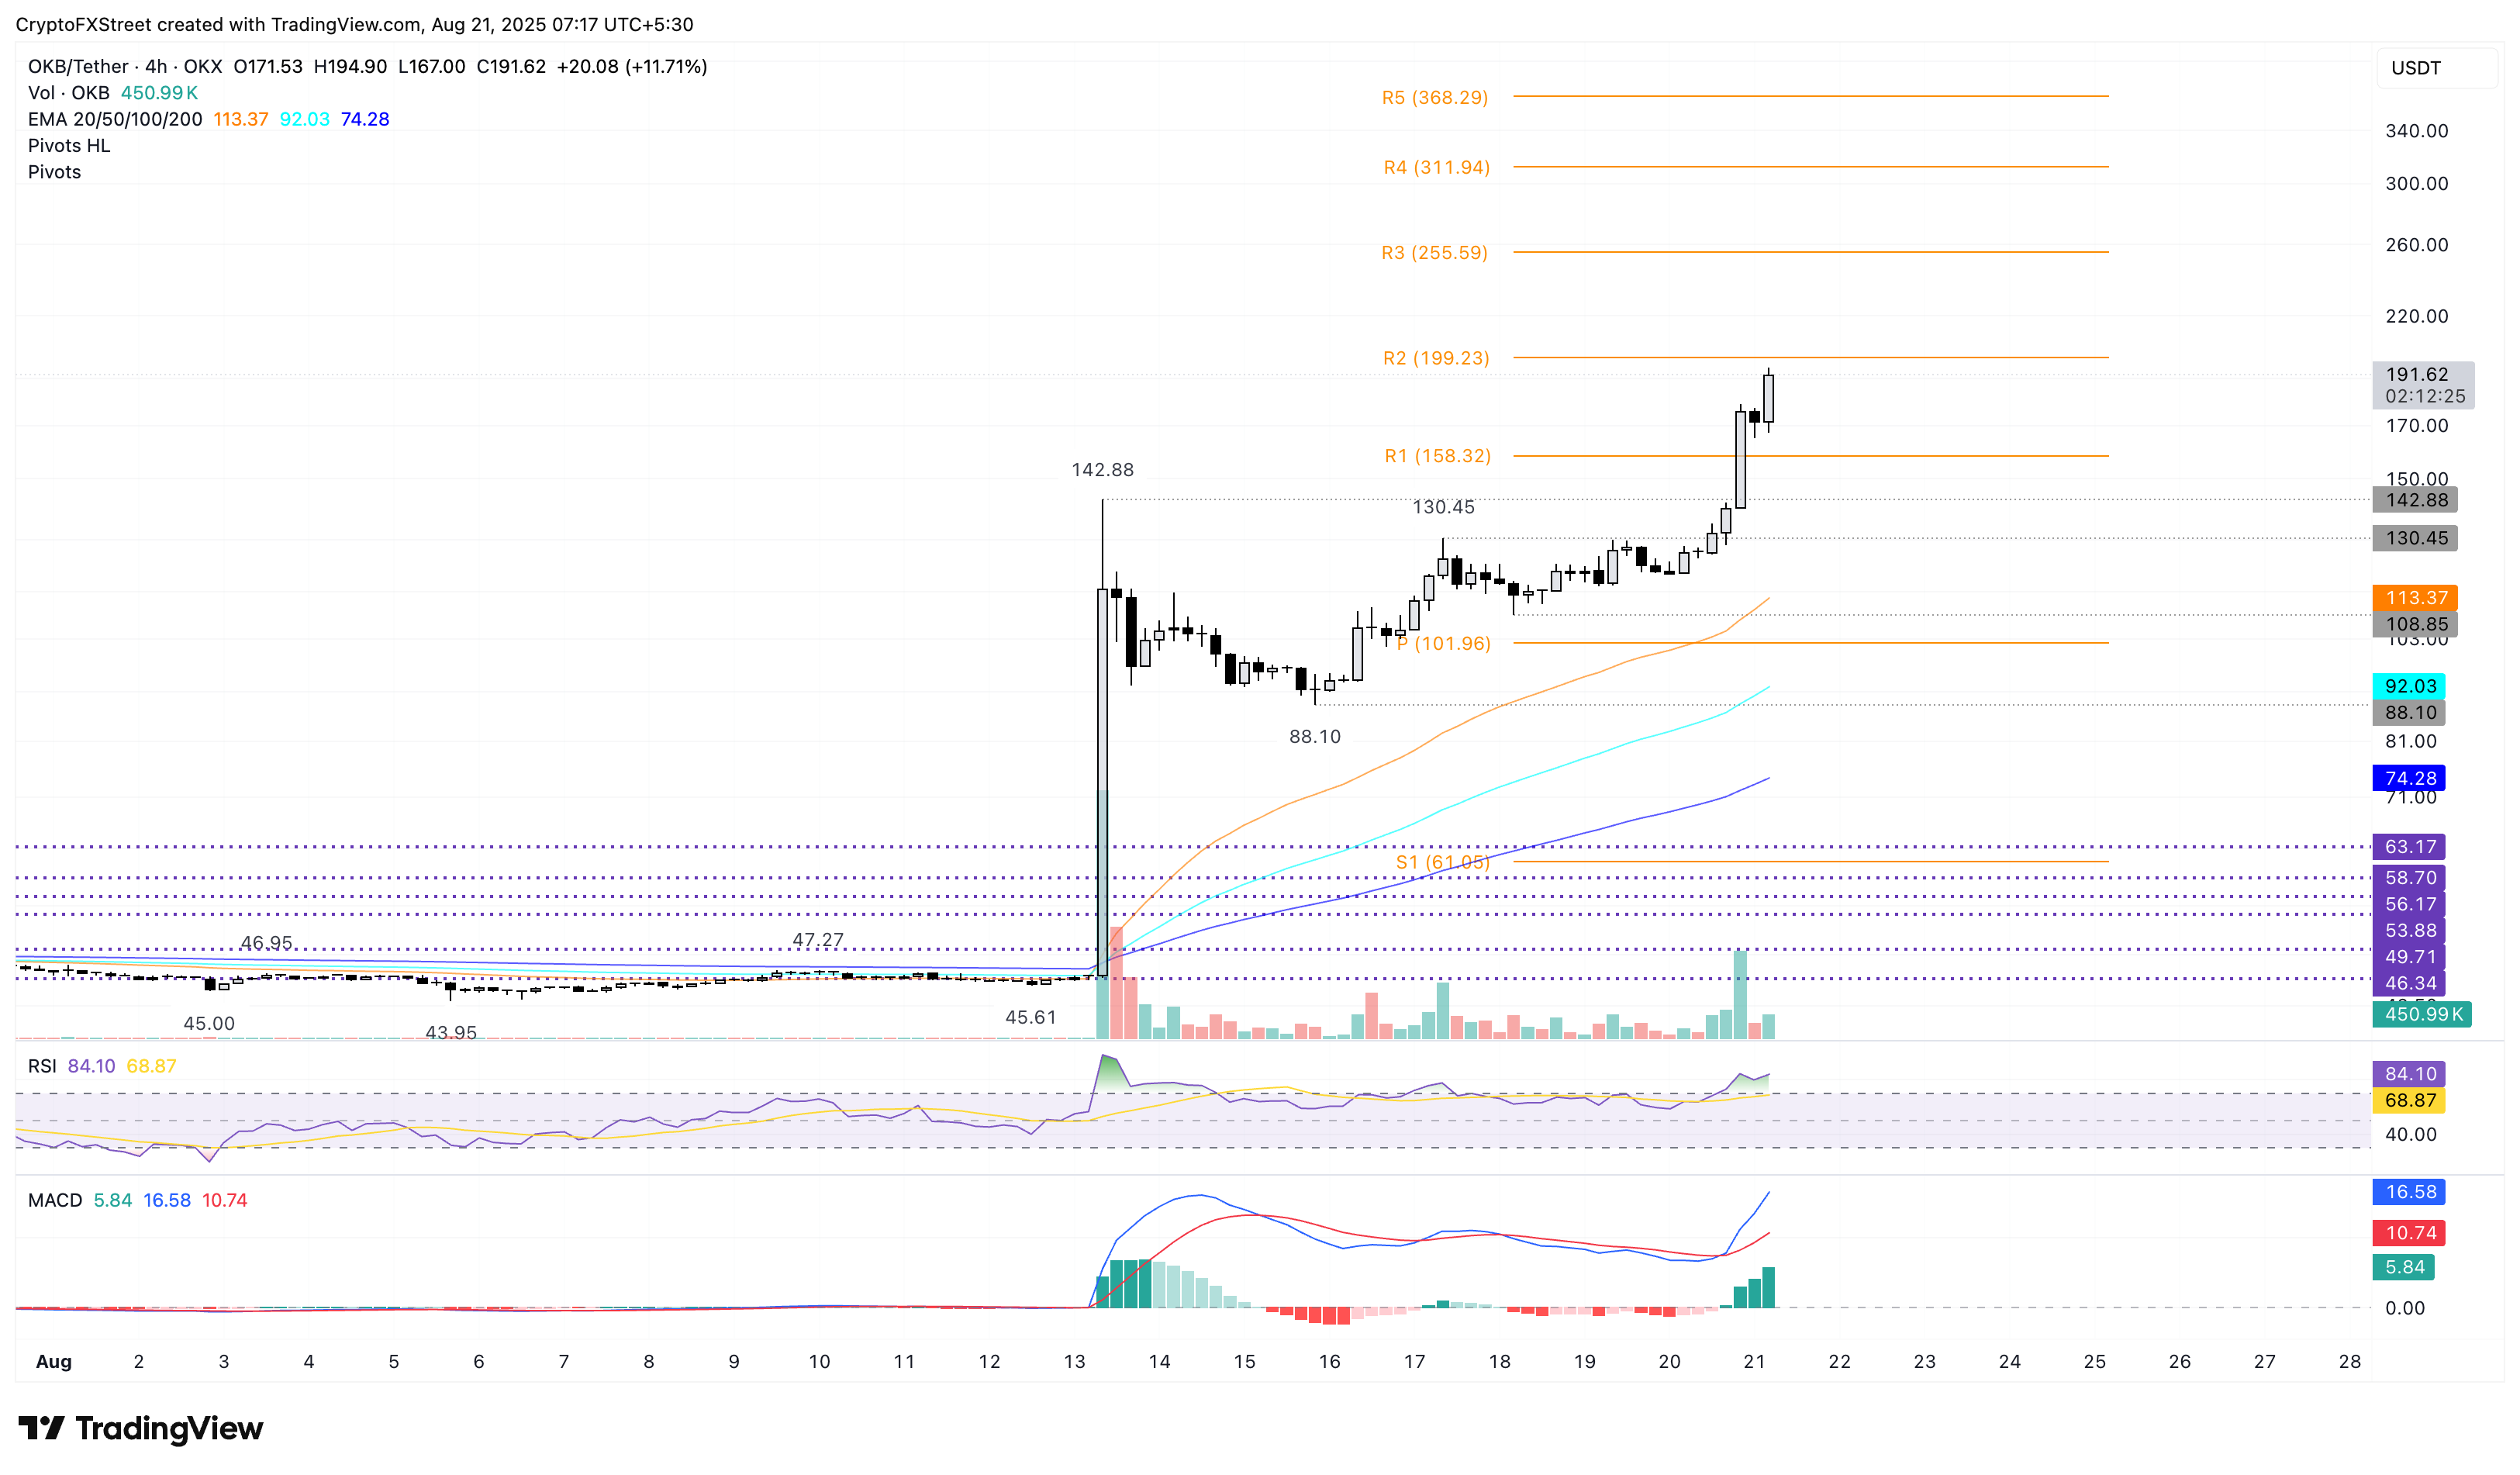
OKB/USDT daily price chart.
Looking down, a potential reversal from the R2 pivot level at $199 could retest the R1 pivot (resistance-turned-support) level at $158.
Reversal in Conflux adds to short-term volatility
Conflux records over 6% rise so far on Thursday, adding to the 12% bounce back from the 50-day Exponential Moving Average (EMA) on Wednesday. The altcoin fluctuates near the centre pivot level at $0.1884.
A clean daily close above this level could target the upper resistance at $0.2291, marked by the July 30 close.
The declining MACD and its signal line move closer to each other, hinting at a potential reversal. A potential crossover would trigger a buy signal based on the fresh rise in bullish momentum.
The RSI at 56 faces higher, as it crosses above its midway point, indicating increased buying pressure with room for further growth.
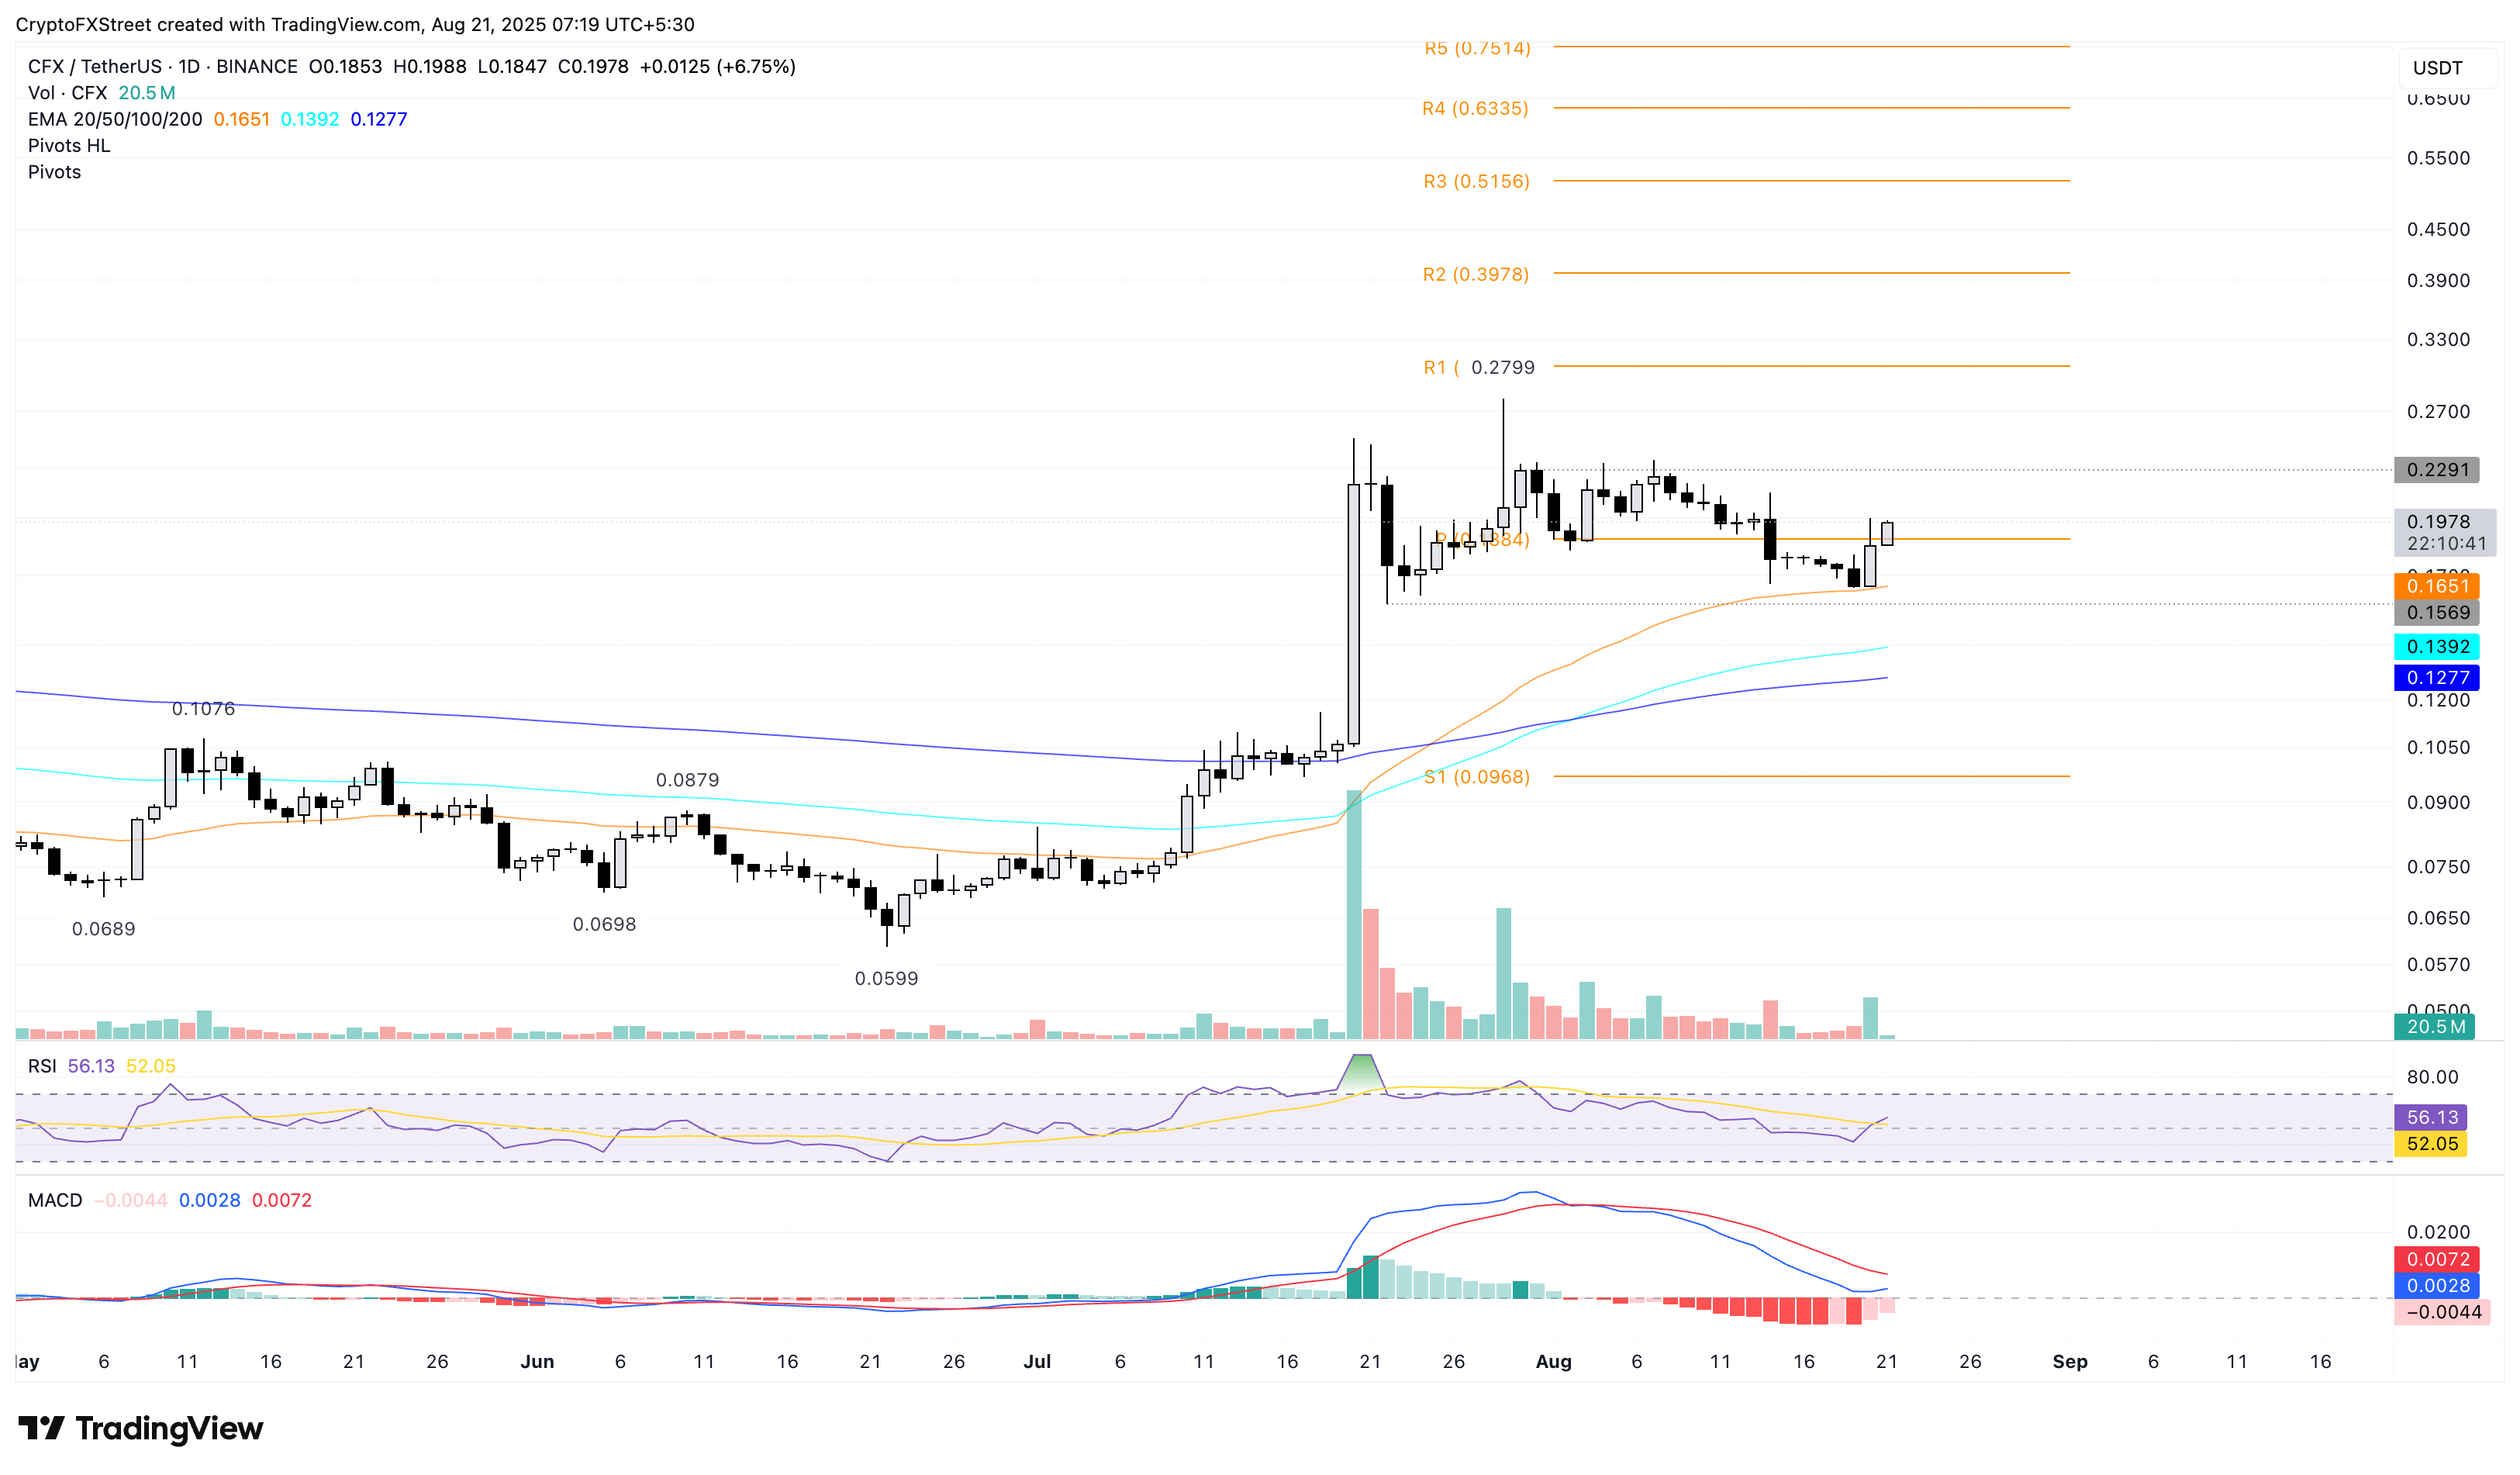
CFX/USDT daily price chart.
On the flipside, a potential drop below the 50-day EMA could test the 100-day EMA at $0.1390.
GateToken rebound eyes $20
GateToken adds over 6% gains at the time of writing on Thursday, extending the 4.49% rise from the previous day. The bounce back from a broken trendline on a daily chart (shared below) surpasses the $18.49 resistance level, last tested on August 14.
A decisive close above this level could extend the uptrend to $20.43.
The MACD bounces off its signal line to uphold a positive alignment, reflecting the bullish momentum still relevant. Additionally, the RSI is at 64 on the daily chart, eyeing the overbought zone amid heightened buying pressure.
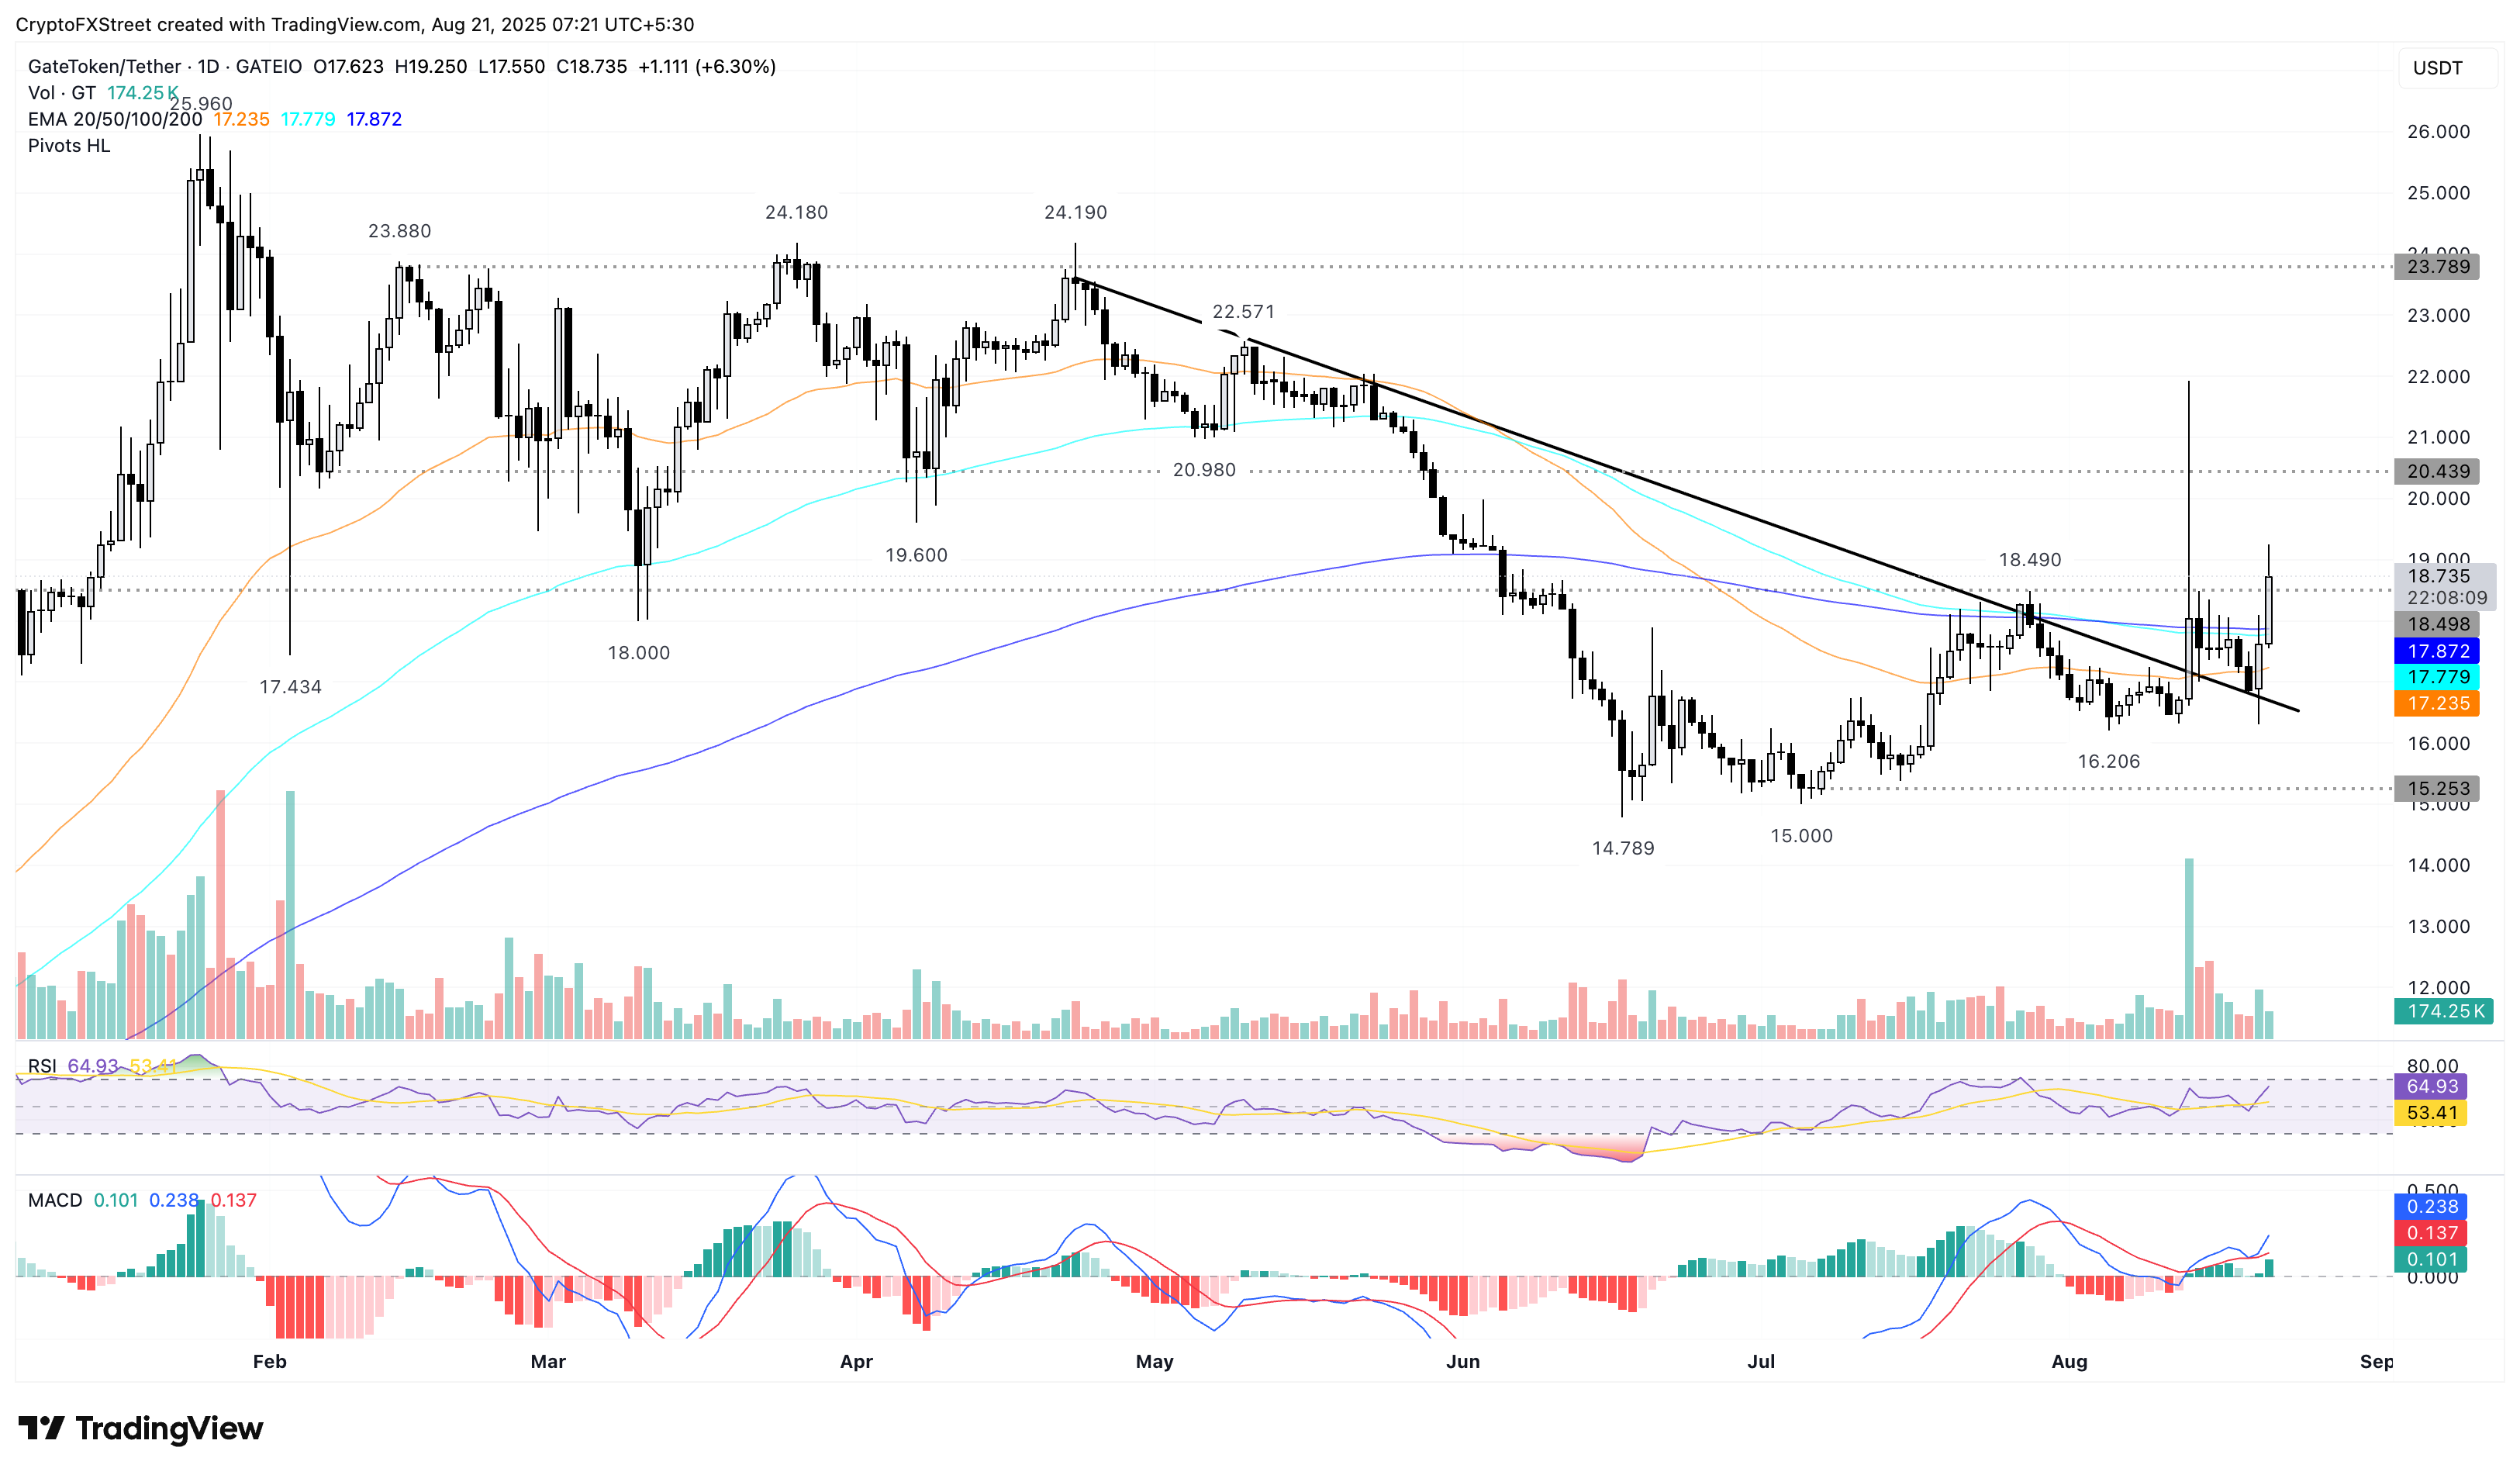
GT/USDT daily price chart.
On the downside, if GT drops below the 200-day EMA at $17.87, it could risk the previous day’s gain, targeting the 50-day EMA at $17.23.
Author

Vishal Dixit
FXStreet
Vishal Dixit holds a B.Sc. in Chemistry from Wilson College but found his true calling in the world of crypto.


