Crypto bulls lost the wheel

Today’s price action in Bitcoin and Ethereum confirms something important: both markets have rolled over, and momentum is shifting back to the downside.
That’s why I’m sharing Wednesday’s Crypto Lab Note with you today - it was published yesterday for my Premium readers, but I want you to see how these setups play out before the next major move unfolds.
Have a nice read!
Market Context
Crypto just flipped into a very “decision-heavy” zone. What looked at first glance like a bullish continuation last week quickly turned into a classic breakout trap, and now both BTC and ETH are trading like the market is looking for lower liquidity pockets before it can even think about another upside attempt.
Bitcoin: What’s really going on here?
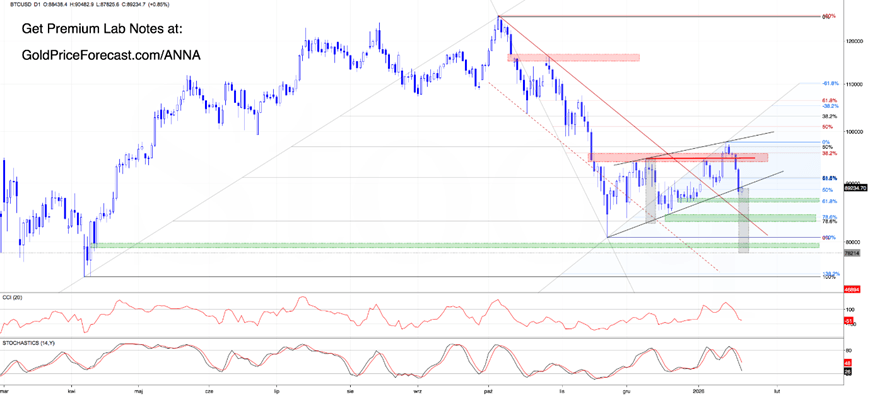
To frame today’s setup, let’s go back to the last week’s quote:
“(…) bulls (…) pushed price into the red resistance zone (as expected) and closed the day above prior highs and the red resistance line, which now looks like a neckline of an inverse head and shoulders formation.
(…) If Bitcoin holds above support (the neckline), it will get continuation potential. BUT if loses it, the risk of a pullback toward the gap around $90,000 will increase. (…)”
Looking at the daily chart, it’s pretty clear: the bulls had the tools… but they didn’t deliver.
Even though BTC managed to close Jan. 14 above the inverse head and shoulders neckline and the 38.2% Fibonacci retracement, the very next day didn’t bring the follow-through you’d expect in a healthy breakout.
Instead, we got a black candle + hesitation + consolidation and… that’s a big deal psychologically.
Why?
Because when price breaks out, then immediately stalls and starts chopping instead of expanding higher, it usually means buyers are not confident enough to defend the move aggressively. That hesitation becomes an invitation and bears see it as: “Okay… if you’re not pushing, we’re going to test you.”
And that’s exactly what happened.
That visible bullish weakness, combined with sell signals from the indicators, brought bears back into the game. Within just one day, they delivered a full invalidation of the earlier breakout above the neckline.
Technical meaning of that price action?
This is the market saying: “That breakout didn’t stick.” And once a breakout gets invalidated, it often flips from “bullish confirmation” into a trap setup, where late buyers become forced sellers on the way down.
Then things got worse.
BTC dropped back below 90,000, closing the bullish gap from Jan. 5, and that’s not just a random detail.
Why?
Closing that gap also killed the island reversal structure, which was basically the bulls’ last clean technical ally. With that gone, the chart loses one of its strongest bullish arguments.
On top of that, Tuesday also closed below the lower border of the black rising wedge, which increases the risk of deeper downside - especially if bulls fail to reclaim the wedge quickly (in other words, if they don’t invalidate yesterday’s breakdown).
So, what’s next for BTC?
If bulls can’t reverse this breakdown fast, bears will likely aim for:
• support zone #1: the area around 61.8% Fibonacci retracement + late-December 2025 lows
• support zone #2: where 78.6% Fibonacci retracement meets the bottom of the former island reversal (December consolidation)
• if that breaks, the door opens toward 80,000
And don’t forget: a confirmed breakdown from a wedge often targets the measured move, which puts 78,214 area on the radar as well (wedge height projection).
Right now, momentum and structure are giving bears the advantage.
Ethereum: Even worse from a bullish perspective
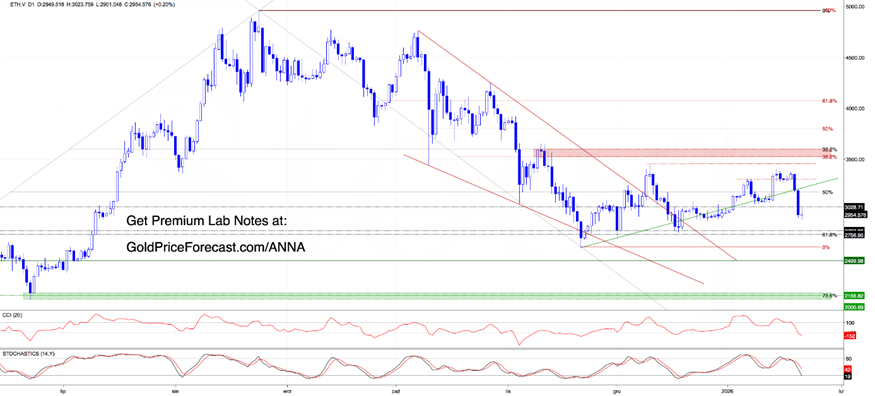
ETH has been the weaker sibling for weeks, and it’s still showing.
Bulls didn’t even get close to the December highs (something we already warned about), and that weakness quickly woke the bears up - especially after Monday’s invalidation of the breakout above the Jan. 6 high, followed by a drop below the green support line that had been holding the bullish structure together.
Now, we have a daily close below that line, which combined with sell signals (still active), is basically signaling: “I’m not ready to lead anything higher right now.”
What’s next for ETH?
The next likely bear target is the 2797-2757 zone, where December lows meet the 61.8% Fibonacci retracement.
If that area fails, the path opens toward the November low or even the psychological 2500 area.
Lab Takeaway (…)
Watch for invalidation attempts: if BTC can reclaim the broken wedge, bulls may still have a shot, but if not, expect bears to keep pressing.
For ETH, keep it simple: it’s still the weaker chart, so it’s more likely to follow BTC lower.
If you’re holding swing positions: focus on the next support zones and how price behaves there because that reaction will likely set the tone for the next few days.
Want free follow-ups to the above article and details not available to 99%+ investors? Sign up to our free newsletter today!
Author

Anna Radomska
Sunshine Profits
Anna's passion for drawing evolved into a fascination with colorful lines and shapes, which later inspired her interest in the stock market.


