Chiliz Price Prediction: CHZ must conquer this level to see 40% breakout
- The Chiliz price is contained inside a descending parallel channel on the 12-hour chart.
- The digital asset faces some resistance ahead but has significant bullish momentum behind it.
- The TD Sequential indicator has presented a buy signal on the daily chart.

The Chiliz price had a massive rebound from a critical support level at $0.38, climbing by 30% in the past three days. CHZ faces another key resistance level before a potential breakout toward $0.74.
Chiliz price aims for new leg up above $0.50
On the 12-hour chart, Chiliz has formed a descending parallel channel that can be drawn by connecting the lower highs and lower lows with two parallel trend lines. The nearest resistance level is the 50 SMA at $0.51.
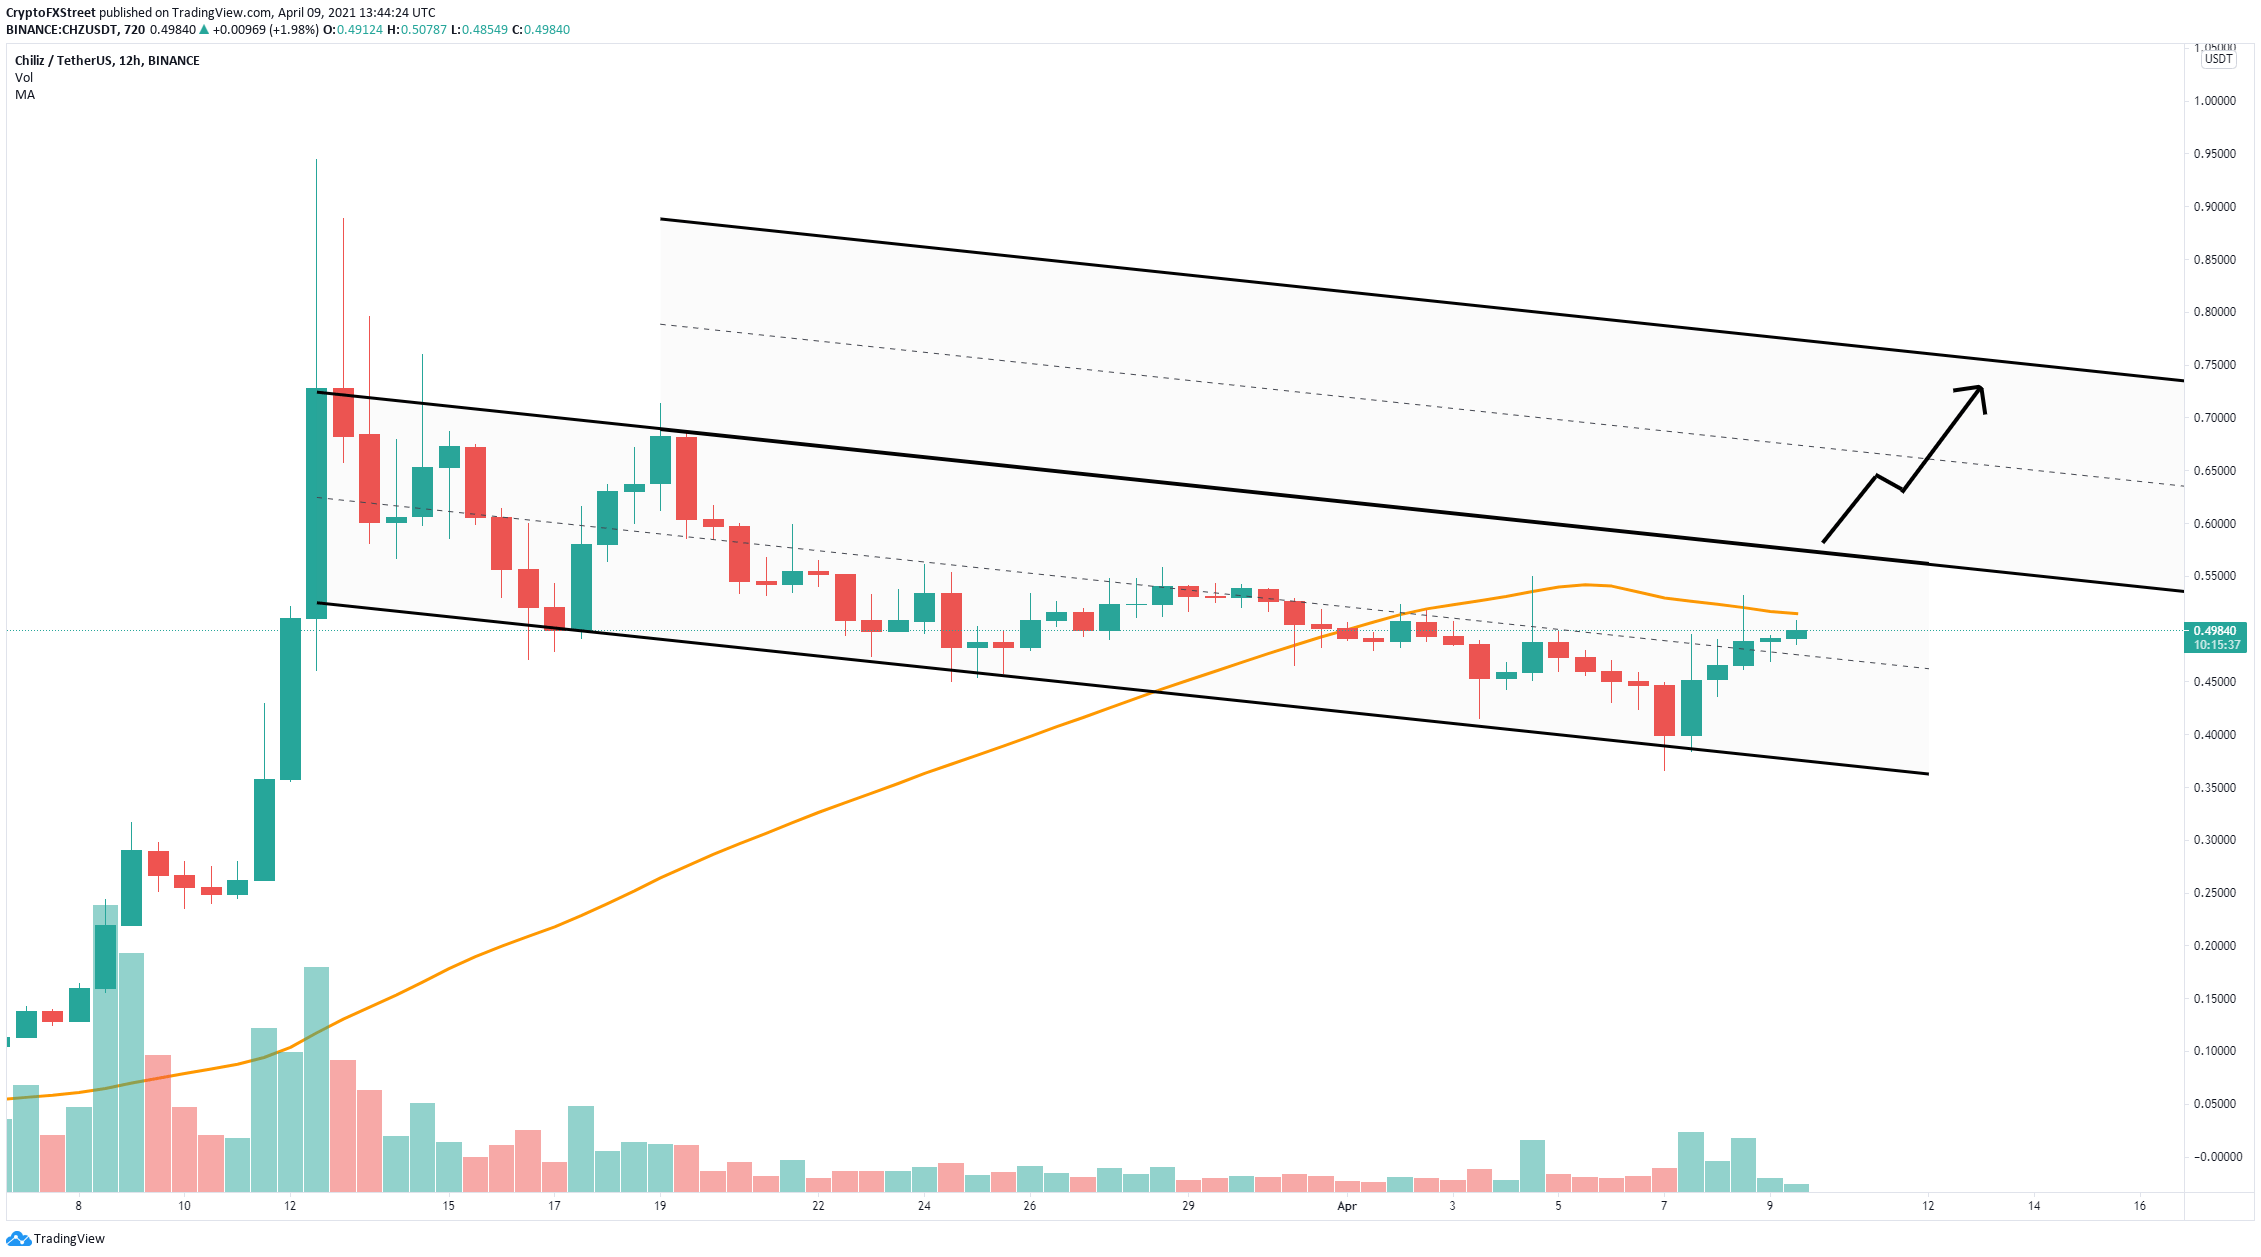
CHZ/USD 12-hour chart
Bulls need to push the Chiliz price above the 50 SMA first to get to $0.57, which is the upper boundary of the parallel channel. A breakout above this point should drive CHZ toward $0.65 initially and up to $0.75 in the longer term.
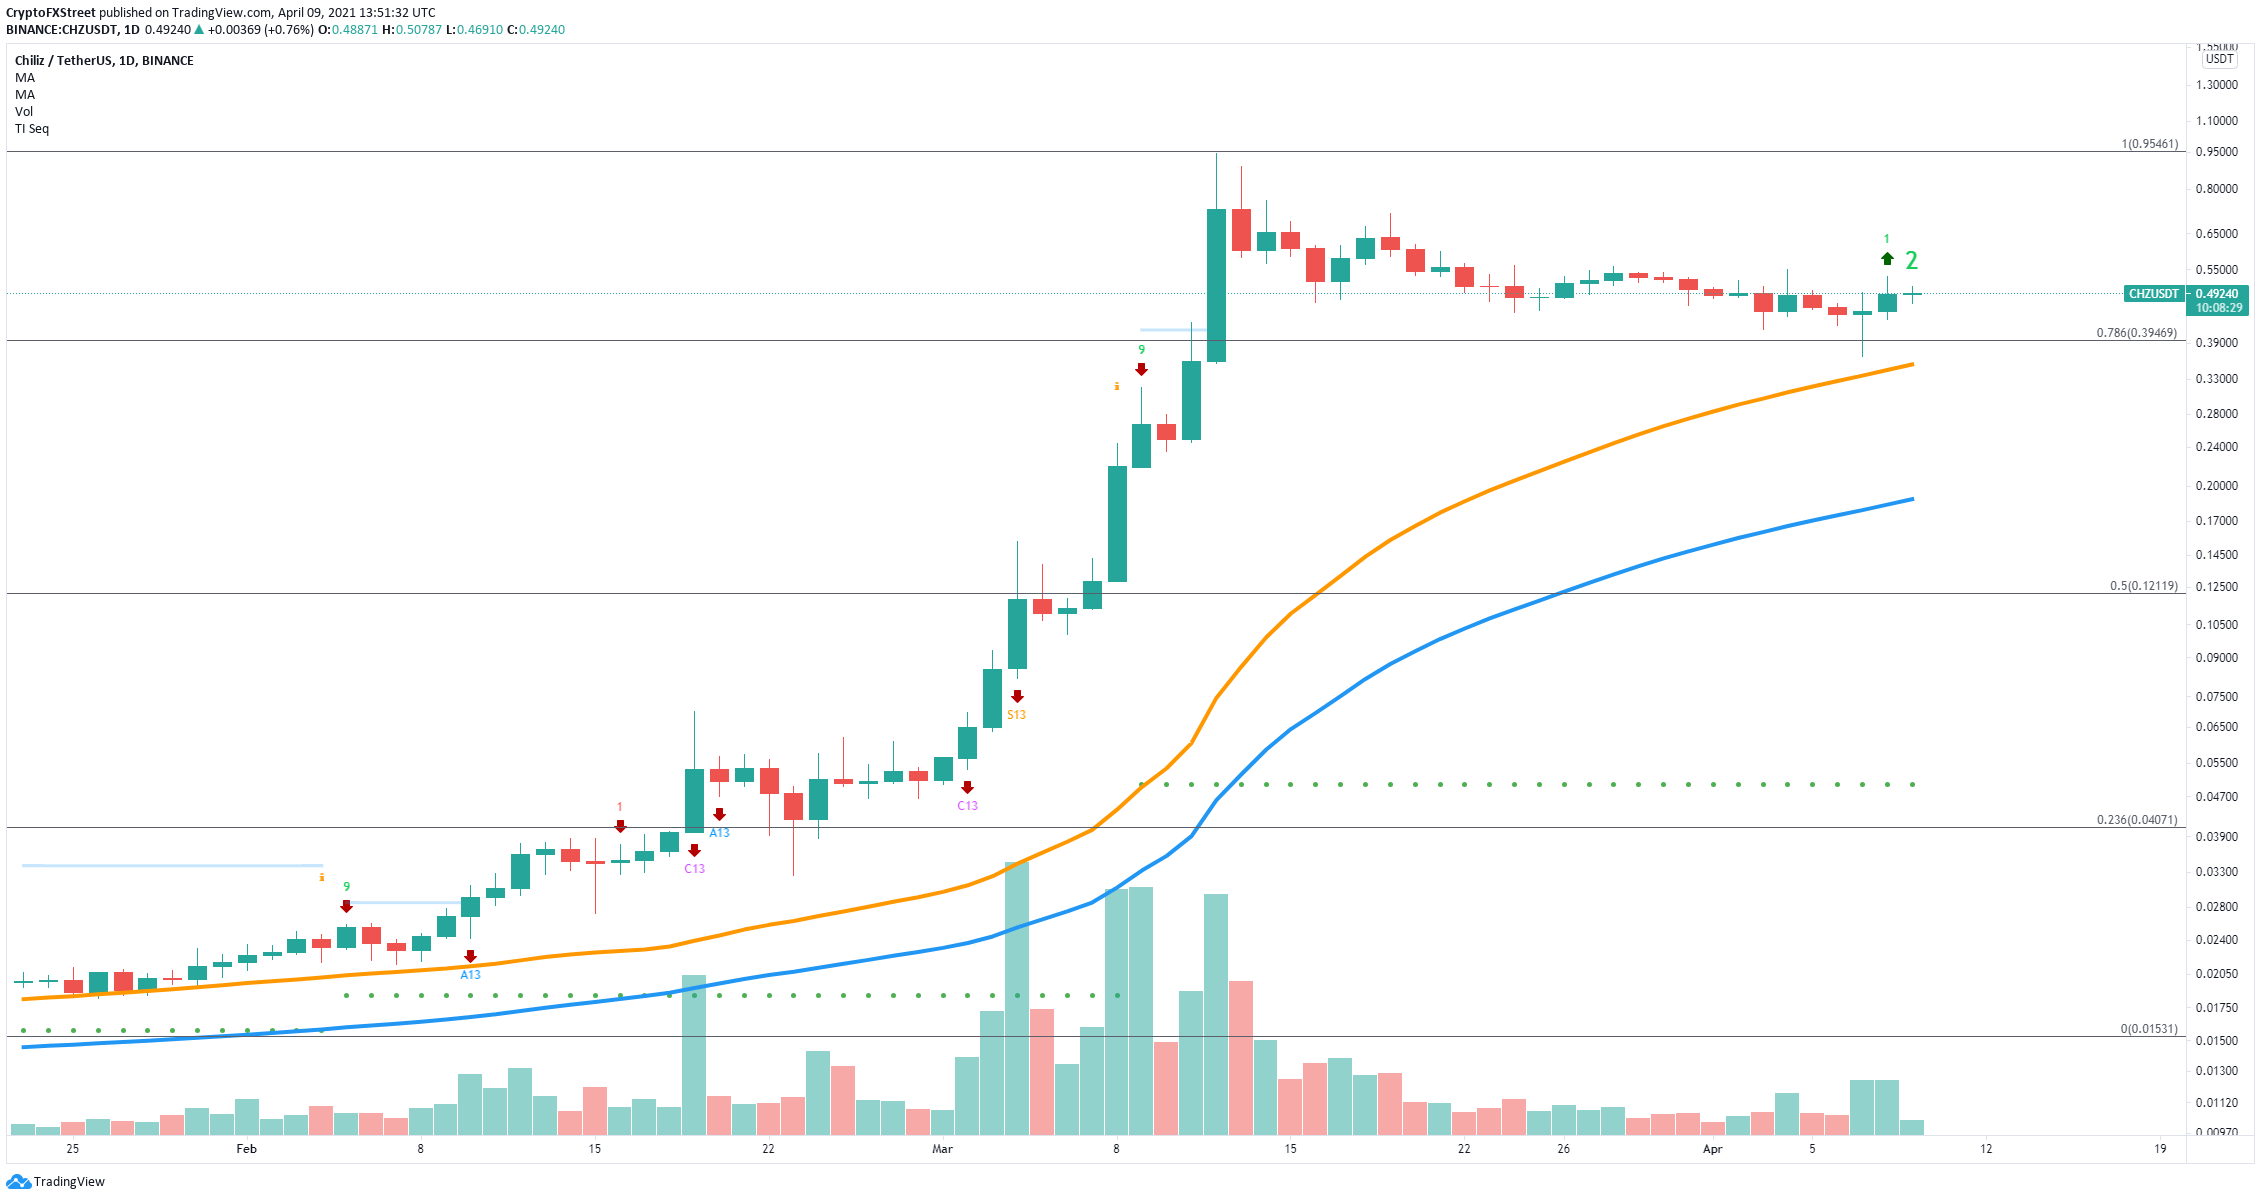
CHZ/USD daily chart
To add even more credence to the bullish outlook, the TD Sequential indicator presented a buy signal on April 8 on the daily chart, which has not been invalidated yet. To stop this signal from confirming, bears need to drive the Chiliz price below the low of $0.436.
A breakdown from this key point can quickly push CHZ down to the 78.6% Fibonacci level at $0.394 and the 50-day SMA at $0.355. The 100-day SMA support level is all the way down at $0.19 as CHZ has not formed many support points on the way up.
Author

Lorenzo Stroe
Independent Analyst
Lorenzo is an experienced Technical Analyst and Content Writer who has been working in the cryptocurrency industry since 2012. He also has a passion for trading.


