Chiliz needs a catalyst to unlock price from downward drift
- Chiliz price has quietly reached the 0.50 retracement level of the rally from the 2021 lows.
- IOMAP shows formidable resistance between $0.493 and $0.506.
- 21-day simple moving average (SMA) is now trending down.

Chiliz (CHZ) price has been trading in a loose descending channel since mid-March with a complete evaporation of volume on the daily chart. It demonstrates that buyers do not exist and sellers are crawling to the exits. As a result, CHZ may need a fundamental catalyst to drive it from the lackluster decline since March 12.
Chiliz price not showing emotion or commitment
The In/Out of the Money Around Price (IOMAP) data shows exceptional resistance between $0.493 and $0.506, which correlates closely with the 0.50 retracement level and the 21-day SMA on the daily price chart.
On the downside, the IOMAP data shows anemic support below $0.439, which corresponds closely to the current price.
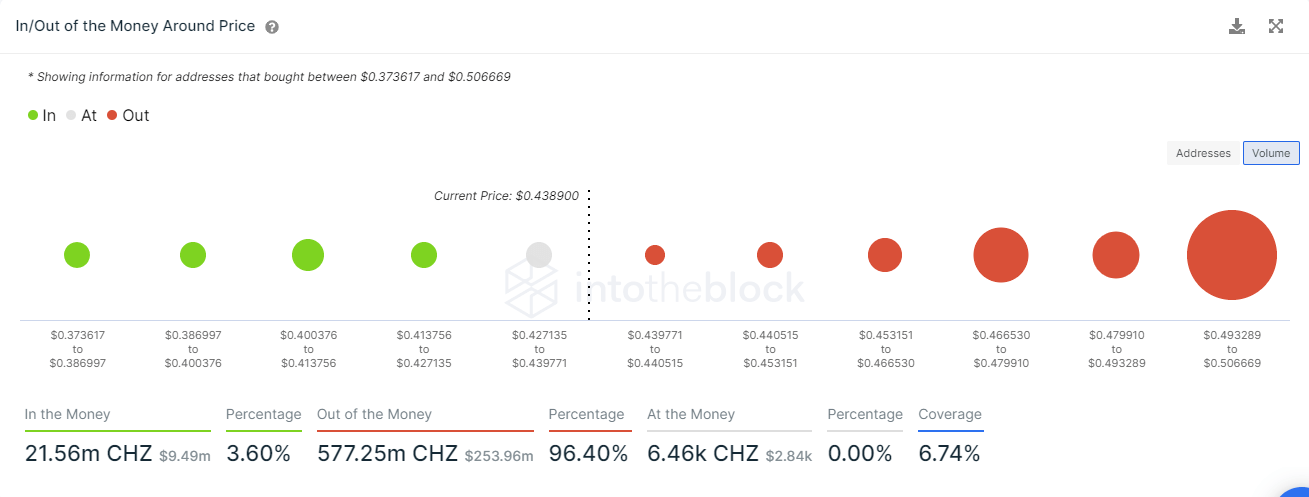
Source: intotheblock
It is only a matter of time before CHZ breaks from the channel. The odds of a break to the downside are high considering the fragile support highlighted by the IOMAP data.
A break to the downside would quickly put the focus on the 50-day SMA at $0.327. No additional support comes into play until the 0.786 retracement level at $0.220. If panic overwhelms the market, traders should look for support at the 100-day SMA at $0.175.
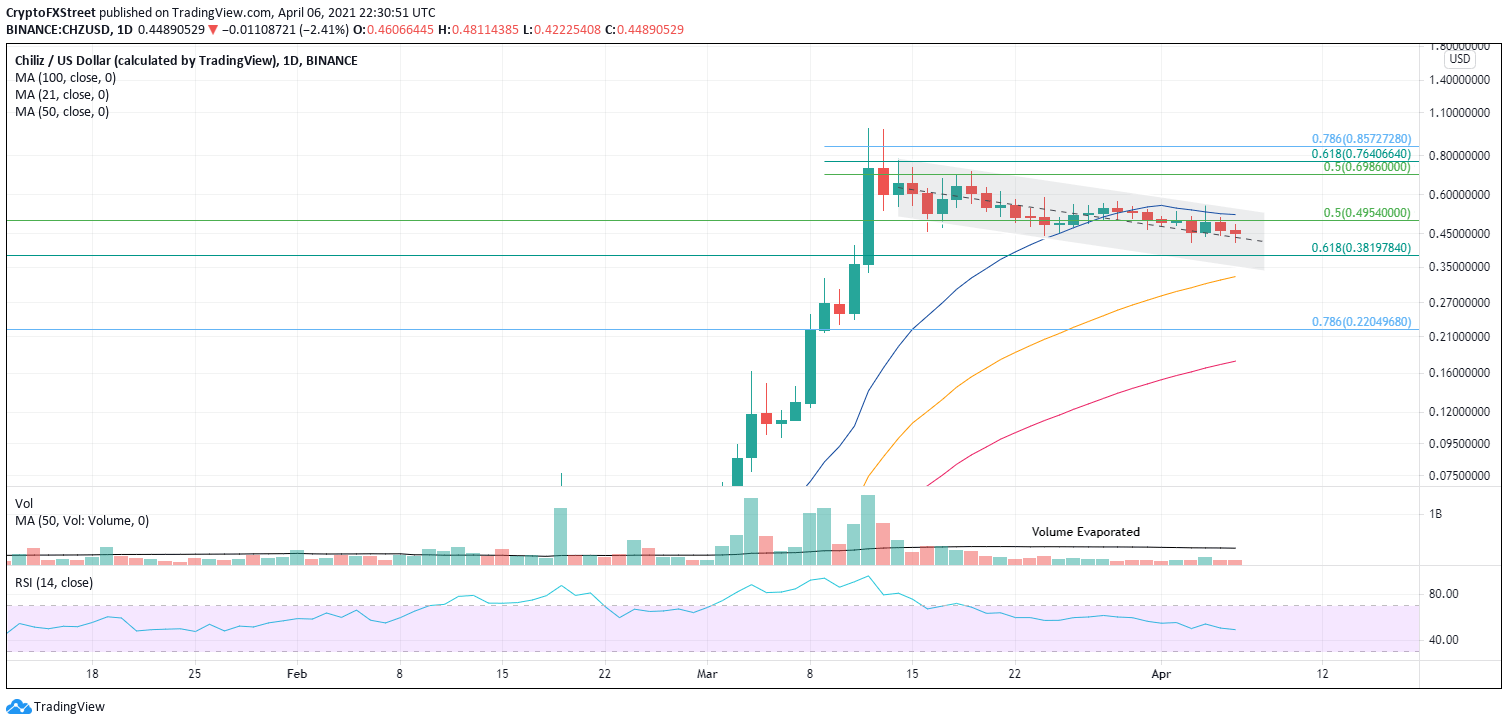
CHZ/USD daily chart
The resistance is now well-noted. However, market participants should not rule out a fundamental catalyst emerging to take control of the market and drive CHZ through the key levels.
Optimistic speculators should target the 0.50 retracement level of the decline since the March high at $0.698 as the first profit target. A follow-through would discover resistance at the 0.618 retracement level at $0.764 and then the 0.786 retracement level at $0.857. A test of the all-time high at $0.976 should be evaluated only after the rebound has begun.
Author

Sheldon McIntyre, CMT
Independent Analyst
Sheldon has 24 years of investment experience holding various positions in companies based in the United States and Chile. His core competencies include BRIC and G-10 equity markets, swing and position trading and technical analysis.