Chainlink price still trapped in range despite exhausted macro downtrend
- Chainlink price eyes the upper boundary of a range at $8.148.
- It comes after the macro downtrend concluded, and could be the path to a new confirmed macro uptrend for LINK.
- Experts corroborate the outlook with data from Santiment, speculating a brief correction before higher highs.

Chainlink (LINK) price is cooking up a recovery rally after exhausting consolidation beneath a macro descending trendline. However, it remains confined within a range in the weekly timeframe, but an opportunity for breaking out could present soon. Notably, this comes as the fourth quarter (Q4) sets in, with anticipation that it could bring altcoin gains akin to the adage that October has historically been a good month for trading.
Also Read: Bitcoin Cash, Chainlink, Maker DAO, THORChain: Four altcoins whose rallies could continue in October
Chainlink price coiling up for a big move
Chainlink (LINK) price recovery rally continues to brew after a 70% fall beginning March 2022 followed by a multi-month consolidation between the $8.148 and $5.565 range. All the while, a macro downtrend line had suppressed the price. Nevertheless, this suppression looks exhausted, giving LINK leeway to forge a new path.
Despite still being in the range, Chainlink price could make one last bounce before shattering past the $8.148 roadblock. Meanwhile, several layers of fair value gaps (FVG) continue to draw LINK north, as existing inefficiencies beg to be filled.
Regarding the bounce, the Relative Strength Index (RSI) points to this effect as it points south to suggest falling momentum. This is supported by the histogram bars of the Awesome Oscillator (AO) that continue to flatten towards the midline and could soon flip negative.
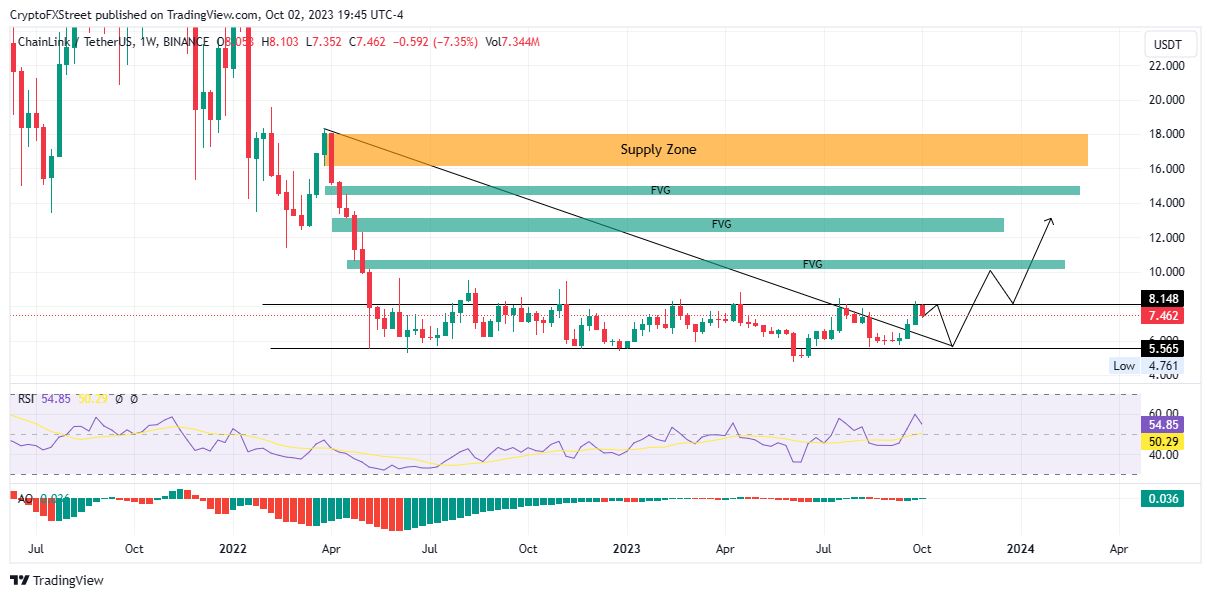
LINK/USDT 1-week chart
An analysis of this outlook has analysts anticipating a correction shortly after the bounce, with Santiment’s Market Value to Realized Value (MVRV) indicator corroborating the story. This ratio between an asset's market’s value to its realized value helps to determine market tops and bottoms. For the layperson, a spike in the MVRV suggests that the market is at the top. Similarly, lows point to the times when the market is in a period of accumulation.
 [02.40.12, 03 Oct, 2023]-638318971841586505.png)
Santiment: LINK MVRV 30D
As indicated in the chart above, every time the MVRV breached the 19% level (peak), it was followed by a steep pullback. Given the latest breach of this level, a steep correction may be underway. This could precede the formation of higher highs.
Conversely, if the $5.565 level fails to hold as a support floor, Chainlink price could slip through to record a new low, and collect the sell-side liquidity resting underneath the aforementioned level while at it.
Notice the RSI tipping south, with the potential to siren a call to sell by crossing below the signal line (yellow band). Traders heeding this call could kickstart a selloff.
Also Read: Top 3 Price Prediction Bitcoin, Ethereum, Ripple: BTC and ETH start October with a bang
Author

Lockridge Okoth
FXStreet
Lockridge is a believer in the transformative power of crypto and the blockchain industry.