Chainlink price looks unstoppable as network activity suggests LINK is heading to $70
- Chainlink starts to set the pace toward $70 supported by key on-chain metrics.
- LINK recently broke above the ascending triangle channel, targeting $35.
- Whales within the project have started to offload their tokens, which could present big selling pressure.
-637336005550289133.jpg)
Chainlink is holding tight to the uptrend after the recent rejection at the all-time high. Defending support above $20 played a crucial role in rejuvenating the ongoing uptrend. LINK is dancing at $28 at the time of writing, as bulls push for gains beyond $30. On the other hand, on-chain metrics suggest that Chainlink is on the verge of a massive breakout eyeing $70.
Chainlink unique addresses rally in support of price growth
Network growth remains one of the critical factors used to understand cryptocurrency projects and their price action. According to Santiment, new addresses join Chainlink’s protocol have rallied incredibly in the past few weeks.
LINK’s network growth has improved consistently from roughly 2,400 addresses per day in November to approximately 6,700 on February 9, representing a 64% rise in 90 days. This growth occurred alongside the surge in price. Therefore, if it continues, Chainlink could be on the road to massive all-time highs.
%20[13.39.37,%2010%20Feb,%202021]-637485523322096616.png)
Chainlink new addresses chart
Chainlink prints a massive bullish outlook
Chainlink recently broke out of an ascending triangle suggesting that it was ready for a 38% upswing to $35. This pattern is bullish and usually results in a breakout target measured from the triangle’s highest to the lowest point. The breakout takes place above the x-axis (currently working as support).
In the meantime, the bullish narrative has been validated by the Relative Strength Index (RSI) on the 4-hour chart. The technical indicator measures the strength of the trend and identifies overbought and oversold areas. For now, LINK is not overbought but can be said to be at the helm as the RSI makes its way into the region.
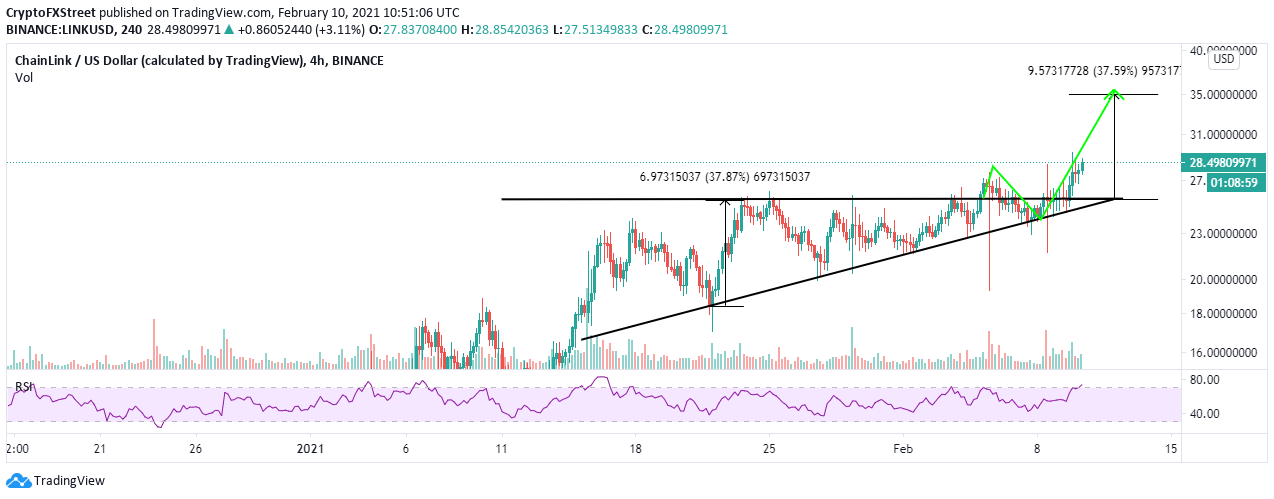
LINK/USD 4-hour chart
Looking at the other side of the picture
It is essential to realize that Chainlink above its former all-time means that it is in price discovery. In other words, nearly 100% of LINK’s addresses are in profit. Therefore, the token is at the risk of losses mostly due to holders selling to profit.
%20[14.02.12,%2010%20Feb,%202021]-637485523424447255.png)
Chainlink holder distribution chart
For instance, the holder distribution by Santiment shows that the whales holding between 100,000 and 1 million LINK have begun offloading their tokens.
From February 3, these addresses have dropped from 283 to 265, representing a 6.4% decline. The volume moved by these whales is massive and could hamper continued price growth and perhaps force a correction.
Author

John Isige
FXStreet
John Isige is a seasoned cryptocurrency journalist and markets analyst committed to delivering high-quality, actionable insights tailored to traders, investors, and crypto enthusiasts. He enjoys deep dives into emerging Web3 tren


