Chainlink Price Forecast: LINK technical breakout eyes 17% upswing
- Chainlink breaks out of a symmetrical triangle pattern, validating the uptrend.
- The IOMAO reveals that the path to the new all-time highs is relatively smooth.
- LINK whales are selling for profit, reducing the risk appetite and increasing overhead pressure.
-637336005550289133.jpg)
Chainlink has resumed the uptrend after closing the day above the 50 Simple Moving Average on the 4-hour chart. The decentralized oracle live price feed token is trading at $33 amid the push by buyers to lift above the recent highs for new record highs around $38.
Chainlink begins another journey to new all-time highs
A symmetrical triangle pattern on the 4-hour chart has paved the way for ongoing gains. The chart pattern is created by a couple of trendlines that link a series of price peaks and troughs. Generally, the trendlines cross at a roughly equal slope. The pattern brings to light a period of consolidation ahead of either a breakout or a breakdown.
Note that a breakdown occurs when price slices through the ascending trendline, which identifies the beginning of a downtrend. On the other hand, a breakout happens at the descending trendline and implies the start of a bullish trend. Symmetrical patterns tend to have precise price targets for the breakout or breakdown, mainly measured from the highest point to the pattern's lowest point.
In this case, Chainlink is getting ready for a colossal 17% breakout to $38 (a new record high). The bullish outlook is validated by the Relative Strength Index (RSI) as it rebounds towards the overbought area.
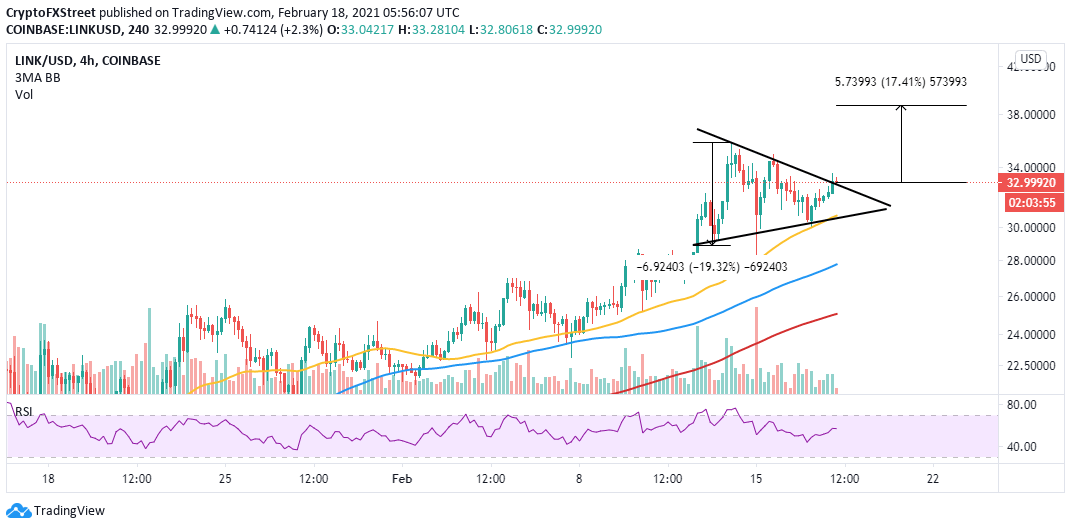
LINK/USD 4-hour chart
IntoTheBlock's IOMAP chart shows that the least resistance path is upwards due to the absence of robust resistance zones. However, it makes sense to focus on the region between $33.8 and $34, whereby 66 addresses had previously bought roughly 291,000 LINK. A boost such as the technical breakout could easily step above this resistance.
On the other hand, immense support has been accorded to Chainlink, starting with the range running from $31.3 to $32.2. Here, approximately 13,300 addresses are profiting from the roughly 12 million LINK previously bought in the range.
-637492270425556917.png)
Chainlink IOMAP chart
Looking at the other side of the fence
Despite Chainlink's price setting up for an upswing, whales in the project are offloading their holdings at a high rate, perhaps to take profit. Santiment's holder distribution metric reveals a significant reduction in the number of addresses holding between 100,000 and 1 million LINK.
%20[09.26.19,%2018%20Feb,%202021]-637492270501963582.png)
Chainlink holder distribution chart
The addresses topped out at 283 on February 3 over a 90-day moving average. However, they have dropped to 259 at the time of writing. In other words, the selling pressure will eventually impact Chainlink, leading to a correction in price.
Author

John Isige
FXStreet
John Isige is a seasoned cryptocurrency journalist and markets analyst committed to delivering high-quality, actionable insights tailored to traders, investors, and crypto enthusiasts. He enjoys deep dives into emerging Web3 tren


