Chainlink Price Forecast: LINK outlook improves as staking rewards and whale activity strengthen network demand
- Chainlink price hovers around $15.35 on Wednesday after finding support around the lower trendline last week.
- The launch of Chainlink Rewards Season 1 encourages staking and token engagement, potentially increasing demand and burn rates.
- Rising social dominance, positive funding rates and large whale orders suggest a bullish sentiment among LINK holders.

Chainlink (LINK) price steadies around $15.35 at the time of writing on Wednesday after finding strong support near the lower trendline last week, signaling renewed buying interest. The launch of Chainlink Rewards Season 1 could boost network engagement and token participation, potentially driving higher demand. Meanwhile, on-chain data also supports a bullish view, with rising social dominance, positive funding rates, and increased whale activity indicating confidence among LINK holders.
LINK launches ‘Chainlink Rewards Season 1’, could boost demand and interest
Chainlink launched the Rewards Season 1 on Tuesday, marking a major milestone in expanding its Build program and community engagement. The initiative allows eligible LINK stakers to earn token rewards from nine Build projects, such as Dolomite, Space and Time, XSwap, Brickken, Folks Finance, Mind Network, Suku, Truf Network by Truflation, and bitsCrunch, by allocating non-transferable reward points known as Cubes. These participants can begin allocating Cubes from November 11 to December 9, with token claims starting December 16 under a 90-day linear unlock schedule.
These developments are bullish for LINK in the long term, as they aim to deepen participation in the Chainlink ecosystem and strengthen demand for LINK through staking incentives and increased on-chain activity, which potentially boosts demand and token burn dynamics.
Chainlink’s on-chain and derivatives data show bullish bias
Santiment’s Social Dominance metric for Chainlink supports a bullish outlook. The index measures the share of LINK-related discussions across the cryptocurrency media. It has risen from 0.15% on Saturday to 1.89% on Wednesday, the highest level since July 2022. This rise indicates growing investor interest and increased community engagement around Chainlink.
 [10-1762924991175-1762924991177.28.19, 12 Nov, 2025].png)
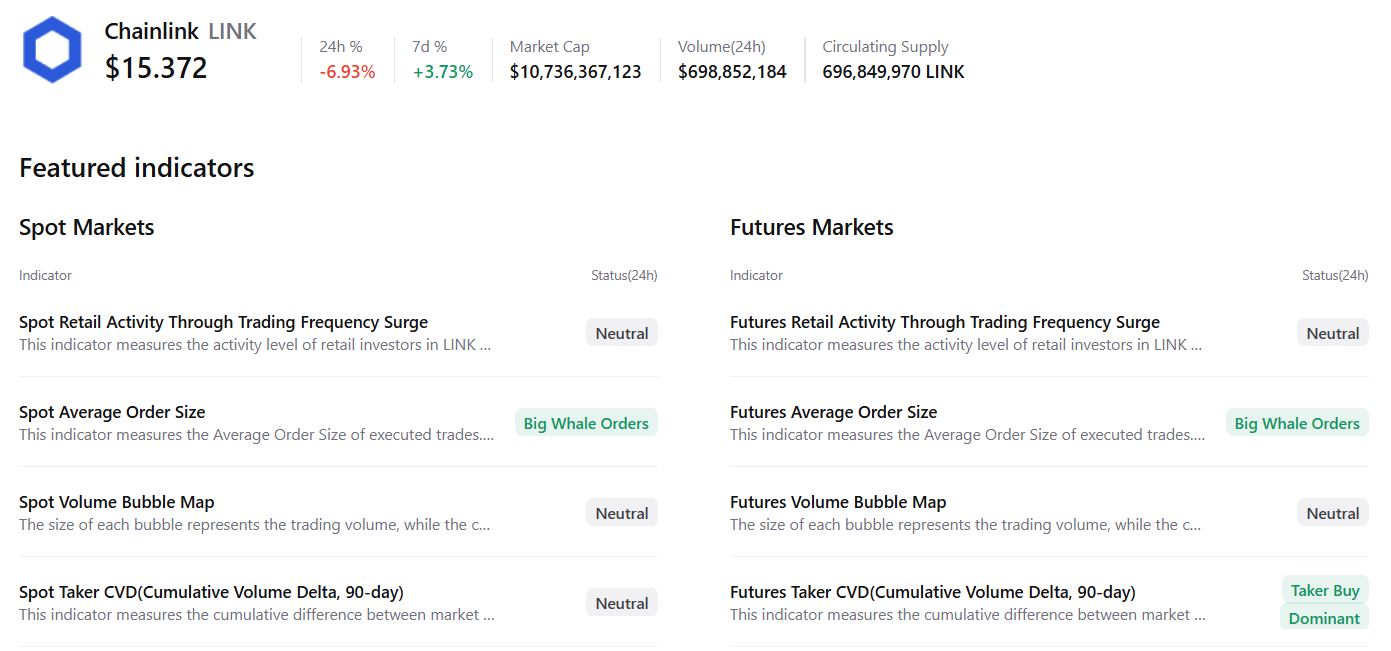
CryptoQuant summary data further supports a positive outlook as both spot and futures markets show large whale orders and buy dominance, signaling a potential rally ahead.
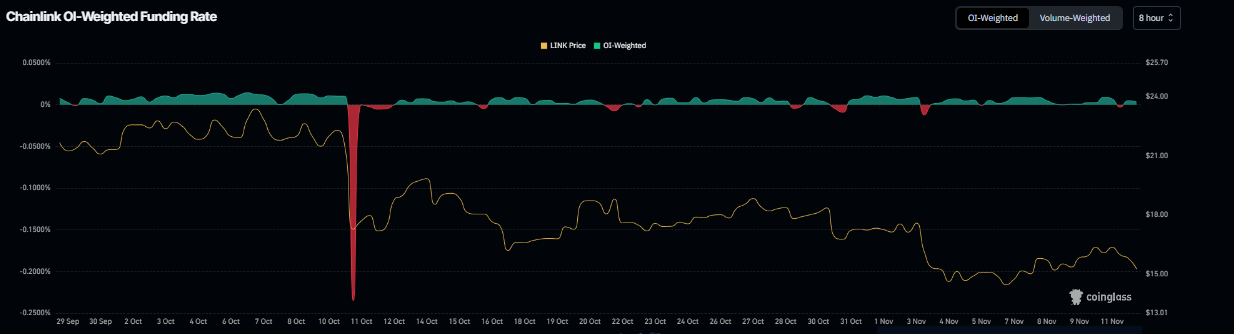
On the derivatives side, LINK appears poised for a recovery rally, as Coinglass’s OI-Weighted Funding Rate data shows that the number of traders betting that the price of LINK will slide further is lower than those anticipating a price increase. The metric flipped to a positive rate on Tuesday and stood at 0.0032% on Wednesday, indicating that longs are paying shorts.
Chainlink Price Forecast: LINK could extend gains if the key level holds
Chainlink price found support near the lower trendline of a falling wedge pattern on November 5, rallying nearly 11% by Monday before retracing 6.60% on Tuesday. At the time of writing on Wednesday, LINK hovers at around $15.35.
If the lower trendline continues to hold as support, LINK could extend the recovery toward the 50-day EMA at $18.12.
The Relative Strength Index (RSI) is 40 on the daily chart, approaching the neutral 50 level and suggesting a fade in bearish momentum. For the recovery rally to be sustained, the RSI must move above the neutral level. Meanwhile, the MACD showed a bullish crossover on Monday, which remains intact, supporting a bullish view.
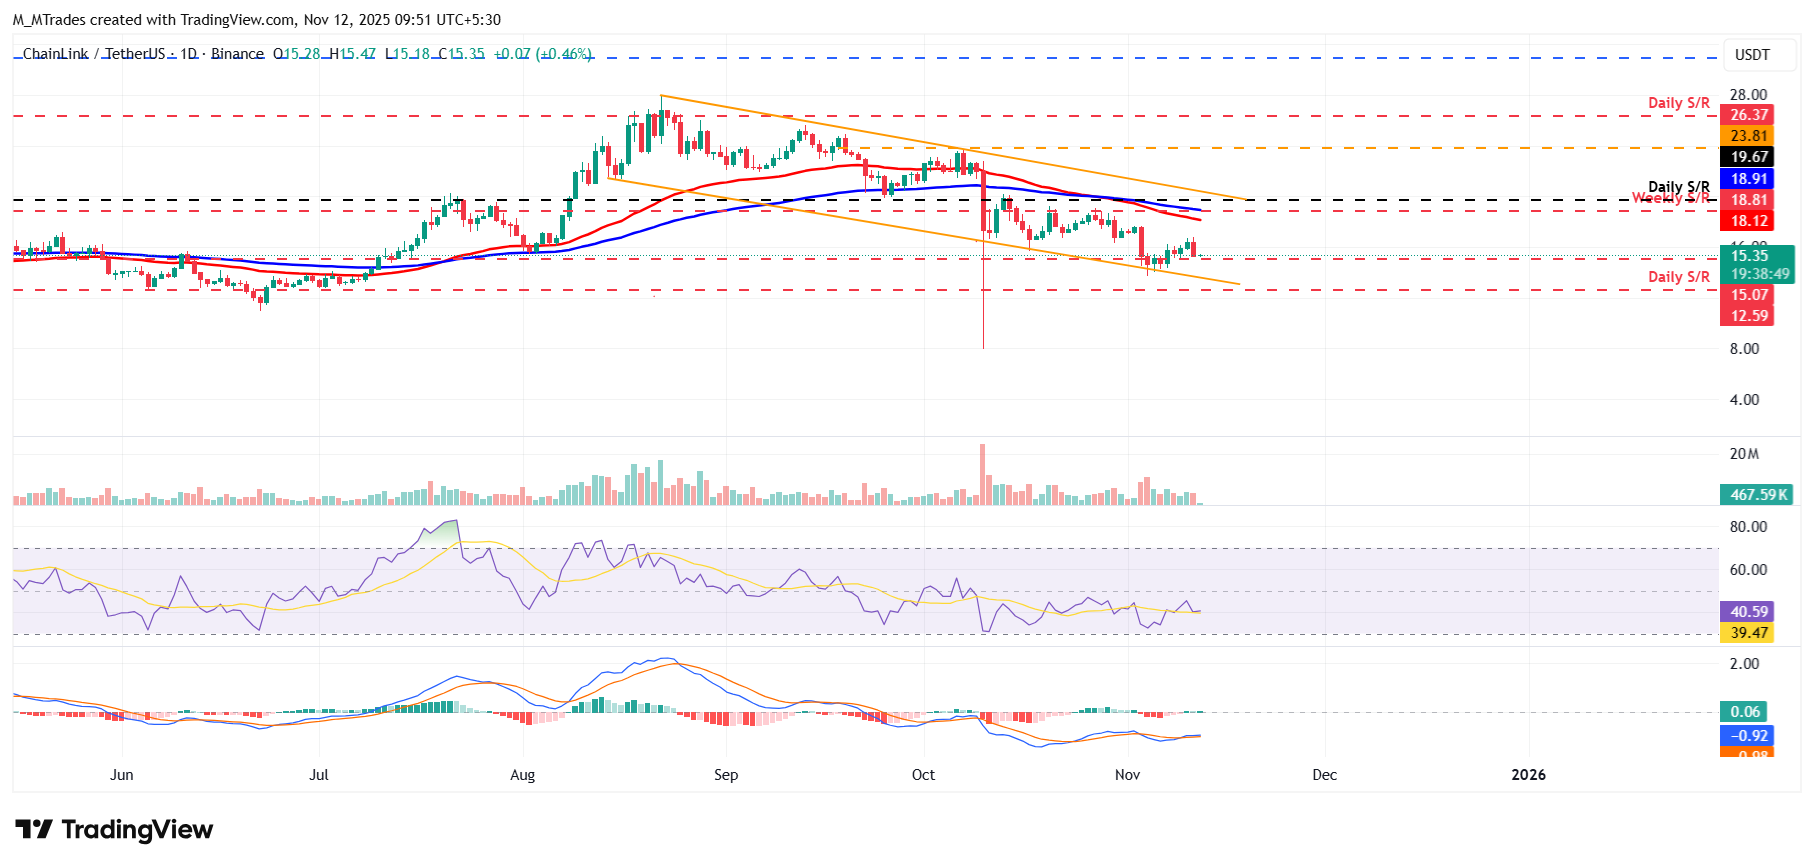
On the other hand, if LINK faces a correction, it could extend the decline toward the next daily support at $12.59.
Author

Manish Chhetri
FXStreet
Manish Chhetri is a crypto specialist with over four years of experience in the cryptocurrency industry.



