Chainlink Price Forecast: LINK confronts a new reality, easy money has been made
- Chainlink price stumbles at the 200-day simple moving average (SMA) after climbing 100% over 24 days.
- July ascending trend line has been broken, increasing pressure on the DeFi coin.
- LINK recorded four consecutive positive weeks for the first time since January.
-637336005550289133.jpg)
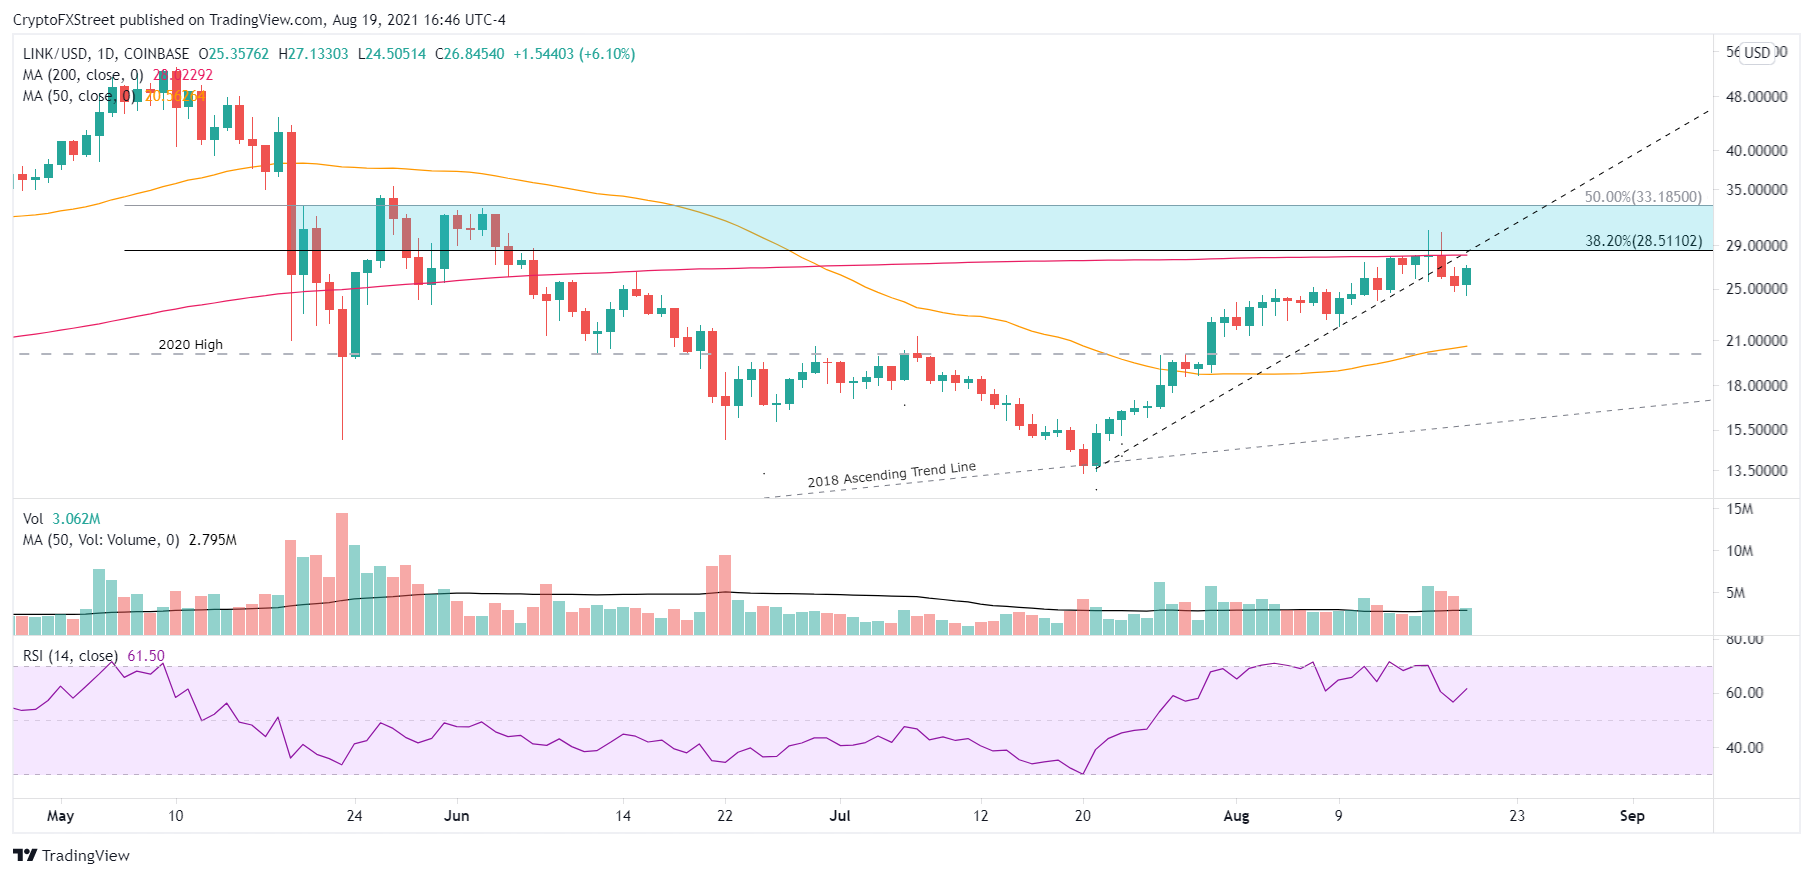
Chainlink price registered a 100% gain from July 21 to August 13, gaining traction on the widespread interest in DeFi tokens and making it the best 24-day gain since January. The impressive rally met heavy resistance at the 200-day SMA and has been trending at or below the moving average over the last six sessions, busting the July ascending trend line on August 17. Based on the stifling resistance and the break of the trend line, there is a high probability that LINK falls into a deeper pullback.
Chainlink price at a technical crossroads
Chainlink price has met heavy resistance at the 200-day SMA at $28.02, which is reinforced by the 38.2% Fibonacci retracement of the May-July cyclical correction at $28.51 and a range of price congestion from late-May and early June. The resulting consolidation has knocked LINK below the tactically important July ascending trend line after two negative days on the largest volume since June 22.
Due to the bearish technical developments over the last six sessions, Chainlink price is now in a vulnerable position with no noteworthy support until the 50-week SMA at $21.95, closely followed by the July 7 high at $21.27, the rising 50-day SMA at $20.56 and then the influential 2020 high of $20.00. A LINK decline to the 2020 high equates to a 24% loss from the current price.
If Chainlink price does not command strong support at the 2020 high, it risks falling to the 2018 ascending trend line at $15.75, thereby rejecting the bullish long-term meaning of the LINK rally from the July low.
LINK/USD daily chart
To pursue a continuation of the rally to the May high of $52.99, Chainlink price needs to beat the dominant resistance framed by the 200-day SMA at $28.02, the 38.2% retracement level at $28.51and the 50% retracement at $33.15. To break the five-point range, LINK will need the fever surrounding the DeFi space to sustain the momentum in the weeks ahead.
Chainlink price is at a technical crossroads, explained by looming resistance, a broken uptrend and no immediate, credible support. Under those conditions, there is no reason for LINK speculators to engage the altcoin until it has booked a daily close above the 50% retracement at $33.18. It is time to accept that the easy money has been made.
Here, FXStreet's analysts evaluate where LINK could be heading next as it struggles to advance further.
Author

Sheldon McIntyre, CMT
Independent Analyst
Sheldon has 24 years of investment experience holding various positions in companies based in the United States and Chile. His core competencies include BRIC and G-10 equity markets, swing and position trading and technical analysis.



