Chainlink price faces minor sell-off before resuming uptrend
- Chainlink price is witnessing its uptrend retreat following a technical signal that indicates the token has reached its local top.
- LINK is headed lower to retest critical support levels as the bears target $28.61 next.
- The token may fall toward the lower boundary of the parallel channel as the bulls catch their breath.
-637336005550289133.jpg)
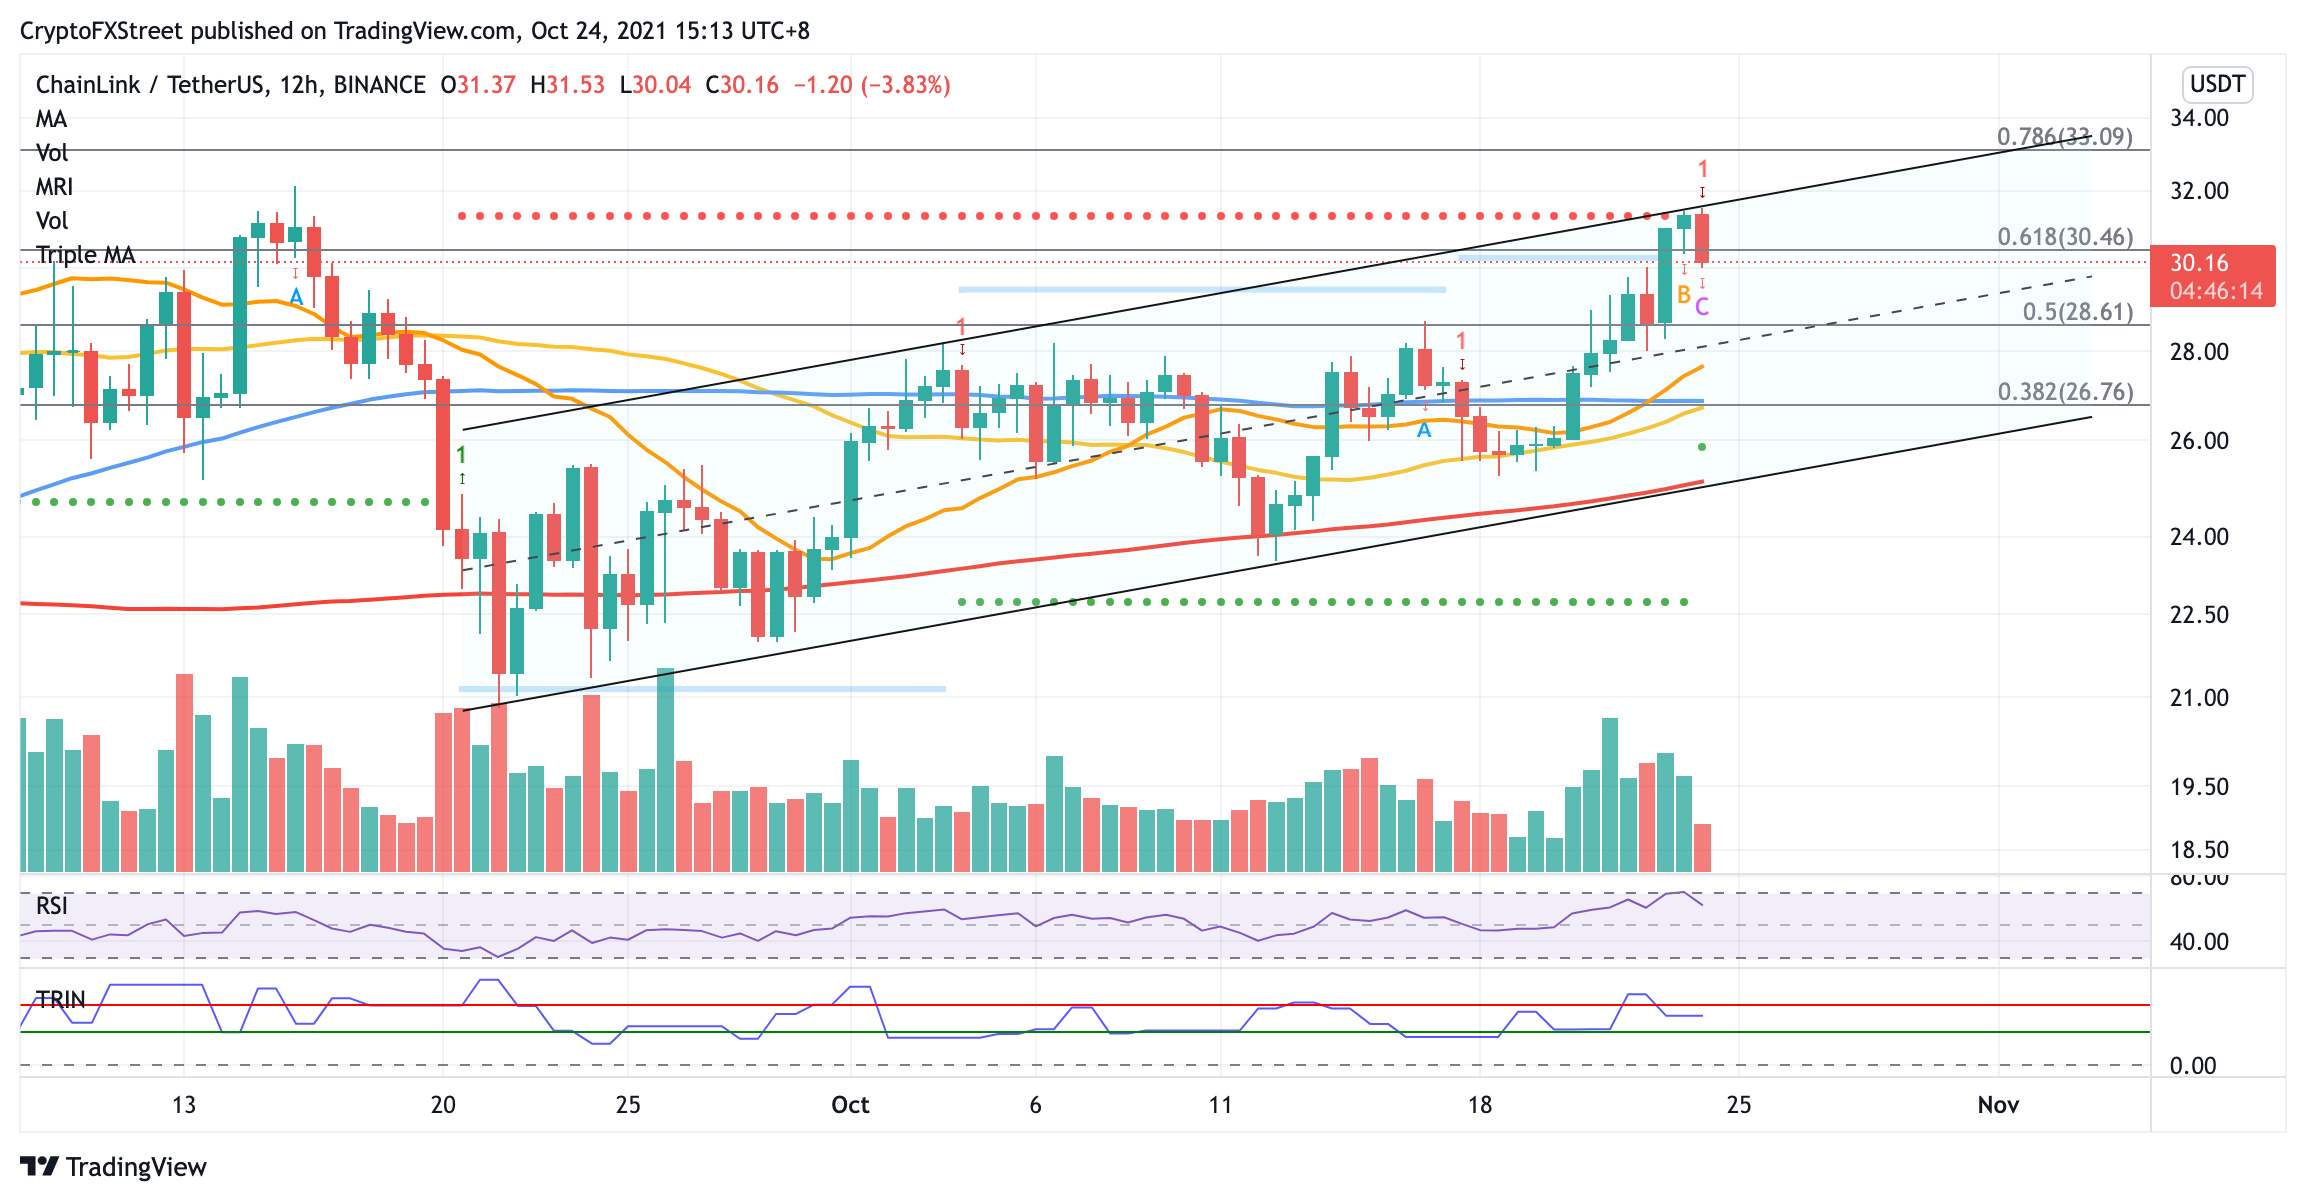
Chainlink price faced stiff resistance at $31.26 as it reached the topside trend line of the prevailing chart pattern and is headed lower as the bulls lose strength. LINK could be headed for a minor sell-off as a critical technical level suggests the token has reached its local top.
Chainlink price dips after facing stiff hurdle
Chainlink price is sliding lower after it tagged the upper boundary of the ascending parallel channel on the 12-hour chart. The Momentum Reversal Indicator (MRI) flashed a top signal at this critical point, suggesting that LINK has just recorded its local top, prompting a sharp reversal.
Although the prevailing chart pattern gives the impression that Chainlink price is headed higher, LINK may need to retest crucial levels of support before resuming its uptrend. The first line of defense for the token is at the 50% Fibonacci retracement level at $28.61.
Additional support may emerge at the middle boundary of the parallel channel at $28.26 before Chainlink price drops toward the 21 twelve-hour Simple Moving Average (SMA) at $27.66. A spike in selling pressure may see LINK fall toward the following foothold at $26.76, where the 50 and 100 twelve-hour SMAs and 38.2% Fibonacci retracement levels converge.
LINK/USDT 12-hour chart
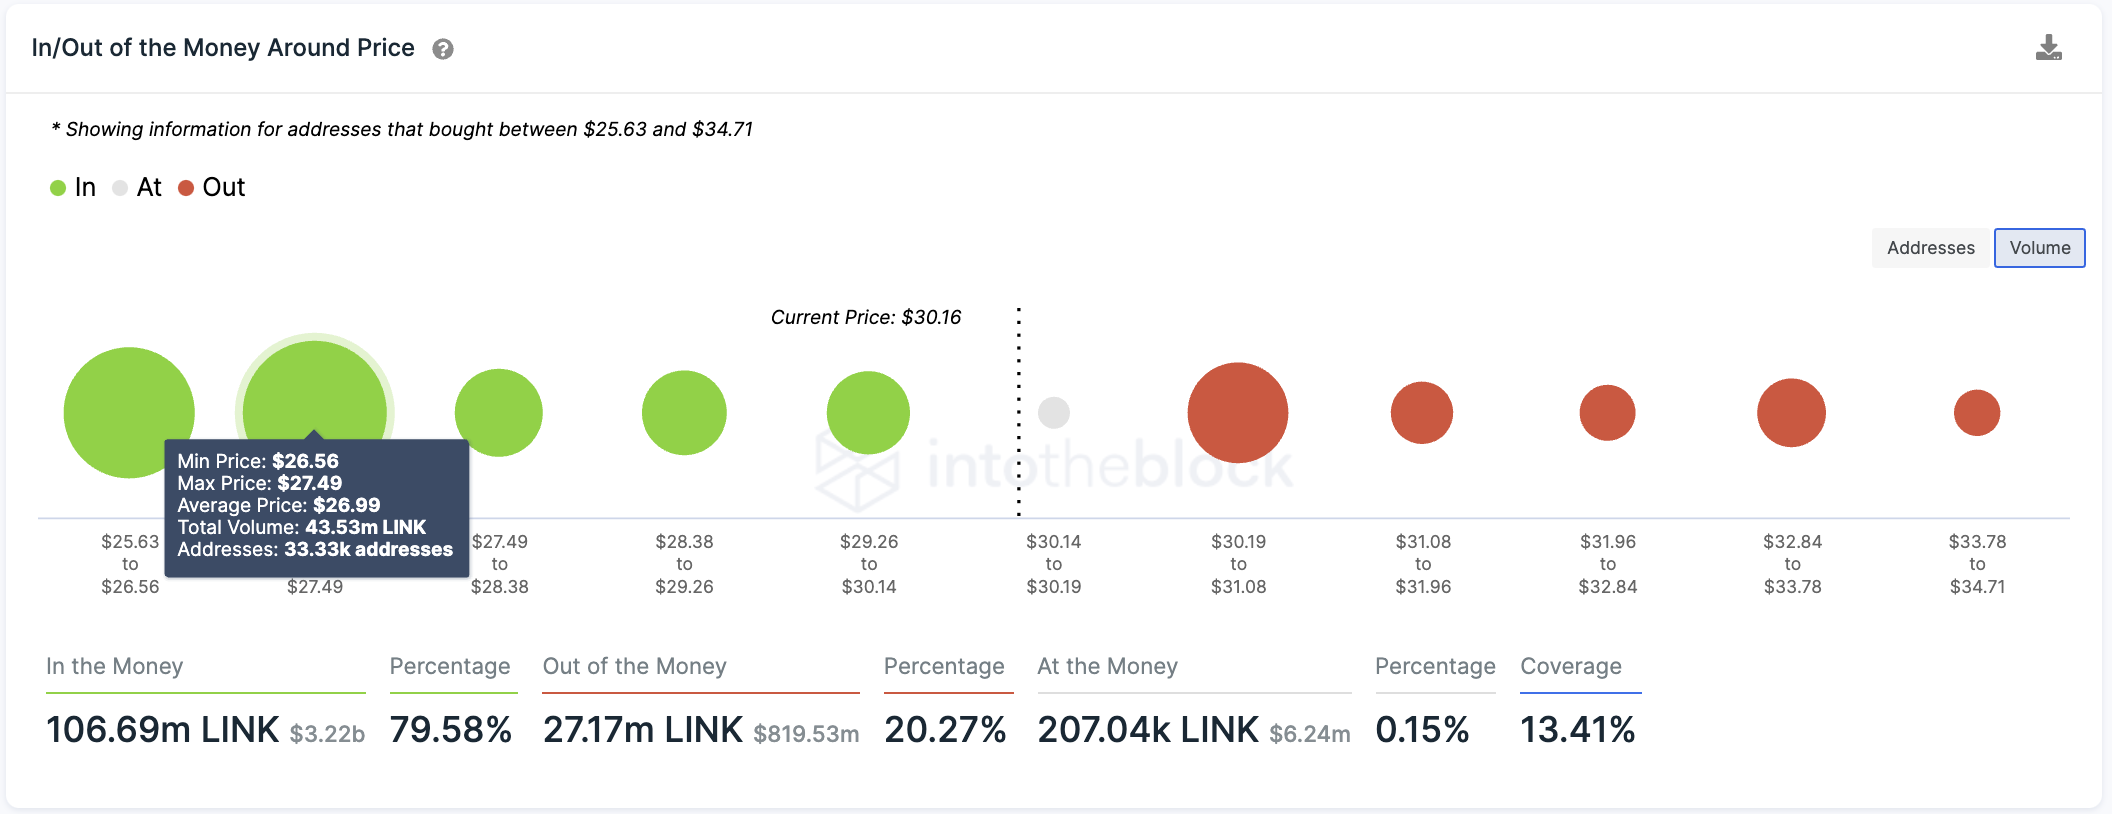
Adding credence to the strength of the aforementioned line of defense is IntotheBlock’s In/Out of the Money Around Price model that indicates that the largest cluster of support of 33,330 addresses purchased 43.53 million LINK at $26.99.
LINK IOMAP
However, should Chainlink price see a surge in sell orders, LINK could slide even further, tagging the 200 twelve-hour SMA, which coincides with the lower boundary of the governing technical pattern at $25.11.
On the flip side, if buying pressure increases, LINK would still need to conquer its first hurdle at the 61.8% Fibonacci retracement level at $30.46 before aiming higher toward the upper boundary of the parallel channel at $31.28, where the MRI presents a resistance line. If the bulls manage to slice above the aforementioned obstacle, Chainlink price could target $33.09 next, at the 78.6% Fibonacci retracement level, to set a higher high.
Author

Sarah Tran
Independent Analyst
Sarah has closely followed the growth of blockchain technology and its adoption since 2016.



