• LINK has lost the $9.22 support level establishing a new lower low.
  • It seems that the digital asset is in free-fall as bulls are struggling to find support on the way down.

ChainLink is down by more than 56% of its peak at $20 on August 16. Although the pullback is notable, LINK is still up 470% since March 13 after the overall market crash. 

LINK/USD daily chart

link price

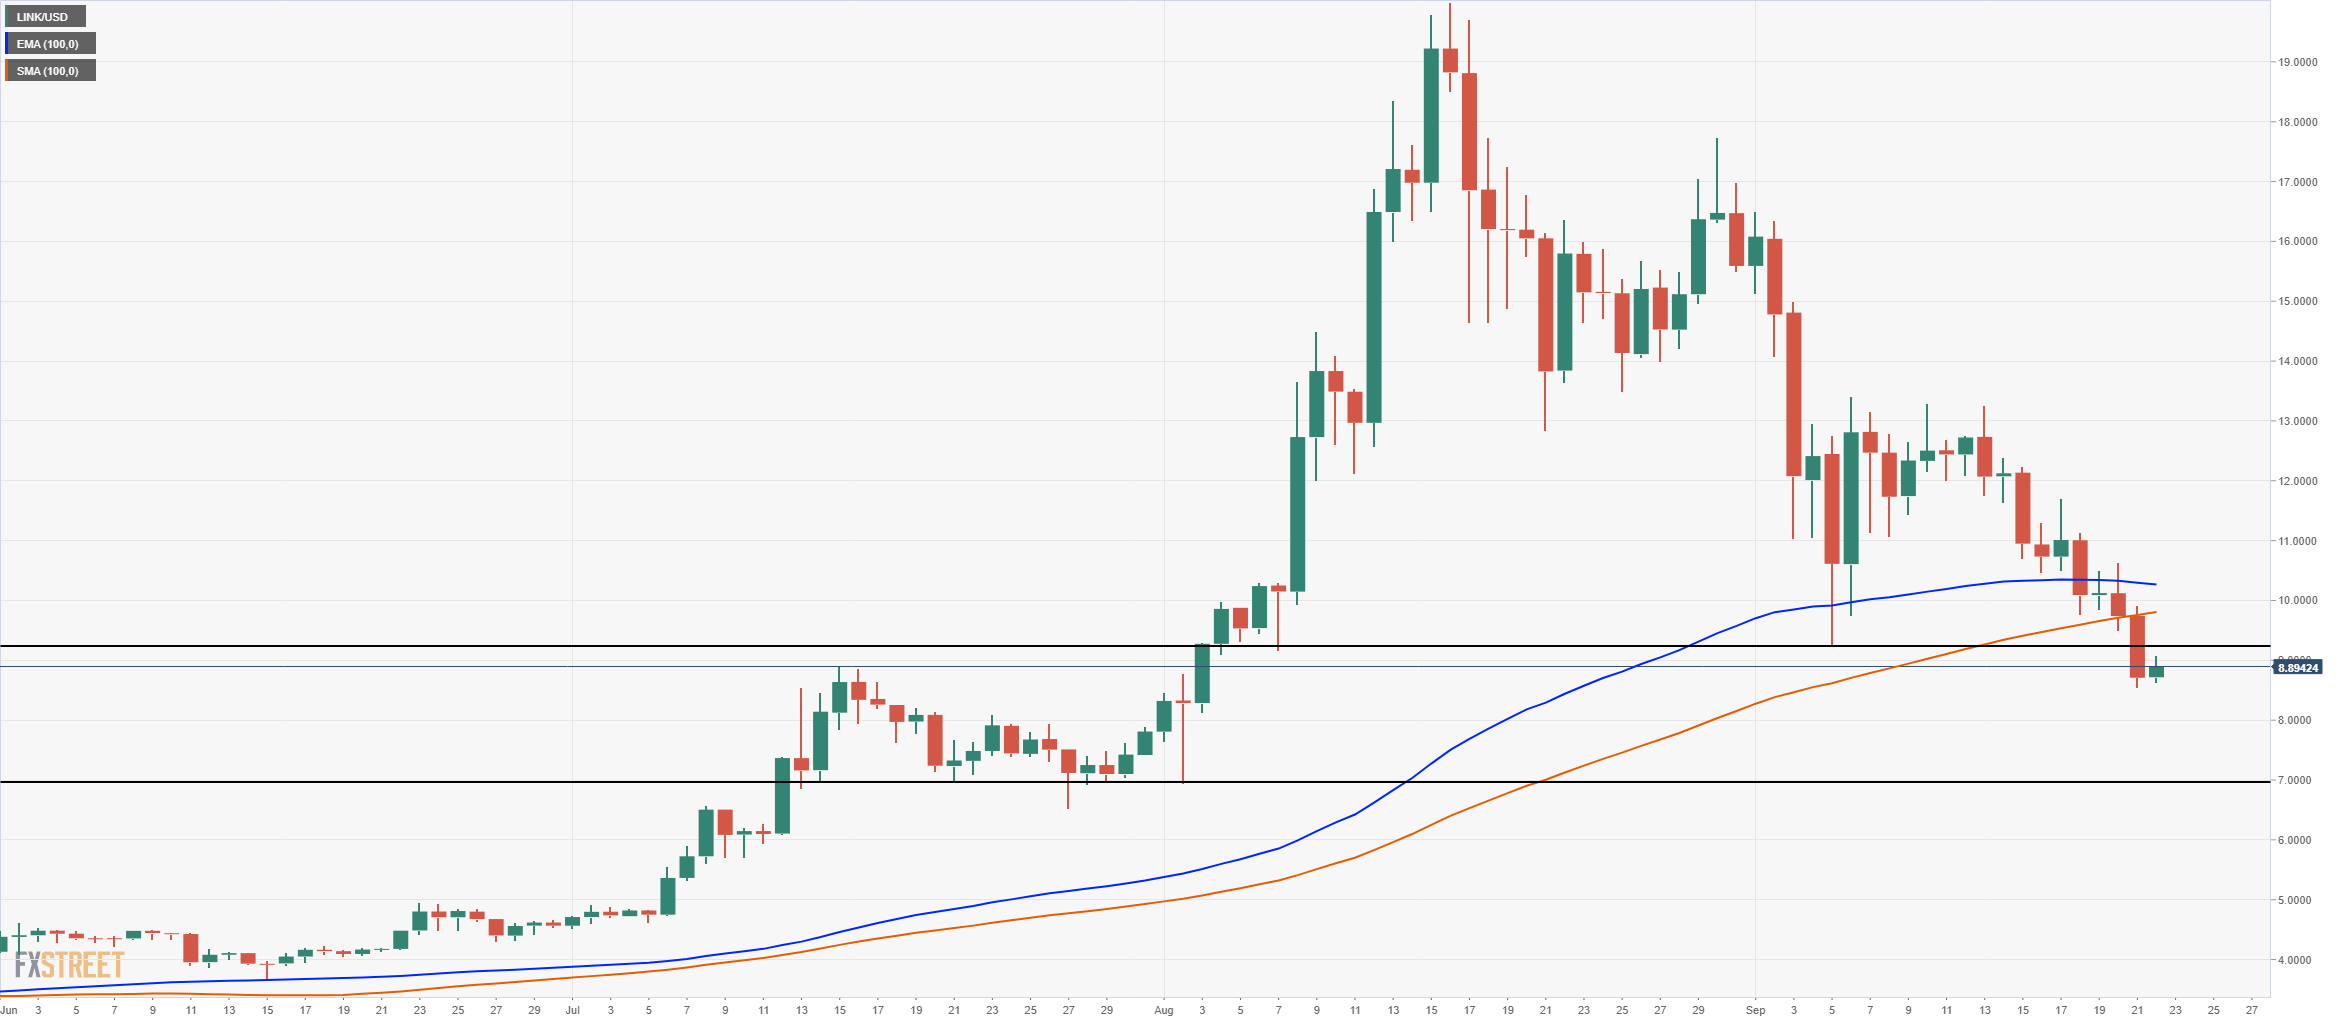
Things aren't looking too bright for LINK on the daily chart after the price pierced through the 100-EMA and the 100-SMA. Furthermore, bears were able to push the price below $9.22, the low of the dump on September 5. 

ChainLink Daily Active Addresses

link price

Looking at the past price action, it seems that the number of daily active addresses usually goes up when a big price pump is about to happen. For instance, back on August 8, the number of addresses jumped to 22,622 from 7,947 and stayed high for the next week while LINK's price went from $10 to $18, only five days later.

It seems that the number of active addresses has continued decreasing since September 5, which would indicate that bulls are not yet back in town. The price of LINK could continue declining towards the nearest support level at $8. 

LINK IOMAP Chart

link price

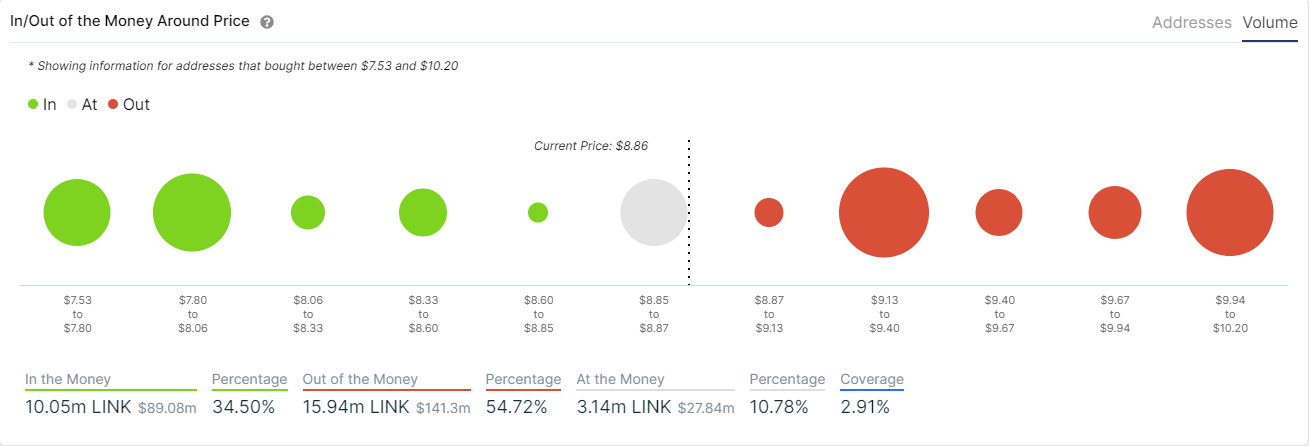
The In/Out of the Money Around Price indicator by IntoTheBlock seems to confirm this theory as it shows relatively low support levels between $9 and 8$ but a strong cluster of addresses that bought at $8. 

LINK/USD 4-hour chart

link price

The bears might have created a bear flag with the pole starting on September 20. Furthermore, looking at the Holders Distribution chart, we can see that the number of whales holding between 100,000 coins and 1,000,000 coins has dropped from 255 on September 1to 252 currently. Similarly, holders with at least 1,000,000 coins also dropped from 51 to 49. 

ChainLink Holders Distribution Chart

link price

However, the MACD is signaling a bull cross within the next few hours, which could invalidate the bear flag if bulls can climb above $9 where there isn't a lot of resistance, according to the IOMAP chart above. 

Investors need to be looking at the $9 resistance level to the upside and $8 as the lowest support level in the short-term.


Note: All information on this page is subject to change. The use of this website constitutes acceptance of our user agreement. Please read our privacy policy and legal disclaimer. Opinions expressed at FXstreet.com are those of the individual authors and do not necessarily represent the opinion of FXstreet.com or its management. Risk Disclosure: Trading foreign exchange on margin carries a high level of risk, and may not be suitable for all investors. The high degree of leverage can work against you as well as for you. Before deciding to invest in foreign exchange you should carefully consider your investment objectives, level of experience, and risk appetite. The possibility exists that you could sustain a loss of some or all of your initial investment and therefore you should not invest money that you cannot afford to lose. You should be aware of all the risks associated with foreign exchange trading, and seek advice from an independent financial advisor if you have any doubts.

Join Telegram

Recommended content


Recommended Content

Editors’ Picks

Ripple wipes out weekly gains, experts comment on role of Ripple stablecoin

Ripple wipes out weekly gains, experts comment on role of Ripple stablecoin

Ripple declined to $0.52 on Thursday, erasing all gains registered earlier this week. Ripple SVP Eric van Miltenburg’s comments on the firm’s stablecoin, and how it is expected to benefit the XRP Ledger and native token XRP have raised concerns among crypto experts. 

More Ripple News

Hedera HBAR slips nearly 10% after air is cleared on mistaken link with giant BlackRock

Hedera HBAR slips nearly 10% after air is cleared on mistaken link with giant BlackRock

HBAR price is down nearly 10% on Thursday, partly erasing gains inspired by the misinterpreted link with BlackRock. Despite the recent correction, Hedera’s price is up 44% in the past seven days.

More Hedera News

The reason behind Bonk’s 105% rise and if you should buy now Premium

The reason behind Bonk’s 105% rise and if you should buy now

Bonk price has shot up 105% in the past five weeks. A retracement into $0.0000216 or the $0.0000152 to $0.0000186 imbalance would be a good buying opportunity. Patient investors can expect double-digit gains from BONK that could extend up to 70%.

More Cryptocurrencies News

Injective price weakness persists despite over 5.9 million INJ tokens burned

Injective price weakness persists despite over 5.9 million INJ tokens burned

Injective price is trading with a bearish bias, stuck in the lower section of the market range. The bearish outlook abounds despite the network's deflationary efforts to pump the price. Coupled with broader market gloom, INJ token’s doomed days may not be over yet.

More Injective News

Bitcoin: BTC post-halving rally could be partially priced in Premium

Bitcoin: BTC post-halving rally could be partially priced in

Bitcoin (BTC) price briefly slipped below the $60,000 level for the last three days, attracting buyers in this area as the fourth BTC halving is due in a few hours. Is the halving priced in for Bitcoin? Or will the pioneer crypto note more gains in the coming days? 

Read full analysis

BTC

ETH

XRP