Chainlink Price Analysis: LINK begins consolidation, new highs will have to wait
- Chainlink price has reached a technical inflection point.
- LINK volume on institutionally viable exchanges doubled its previous quarterly high in Q1.
- Weekly Relative Strength Index (RSI) not confirming the February and April price highs.
-637336005550289133.jpg)
Chainlink price rallied almost 40% from the breakout on April 2 and reached the topside trend line target outlined in an April 5 FXStreet article. The immediate outlook is focused on consolidation that should oscillate around the trend line at $44.20 and the 261.8% Fibonacci extension of the August-September 2020 correction at $40.52.
Chainlink price is exciting crypto hobbyists looking for the next breakthrough token
The current Intotheblock In/Out of the Money Around Price (IOMAP) data shows substantial support for LINK around today’s low with 3.72k addresses buying 2.77 million LINK. It suggests that the consolidation should not deviate too far below $38.04.
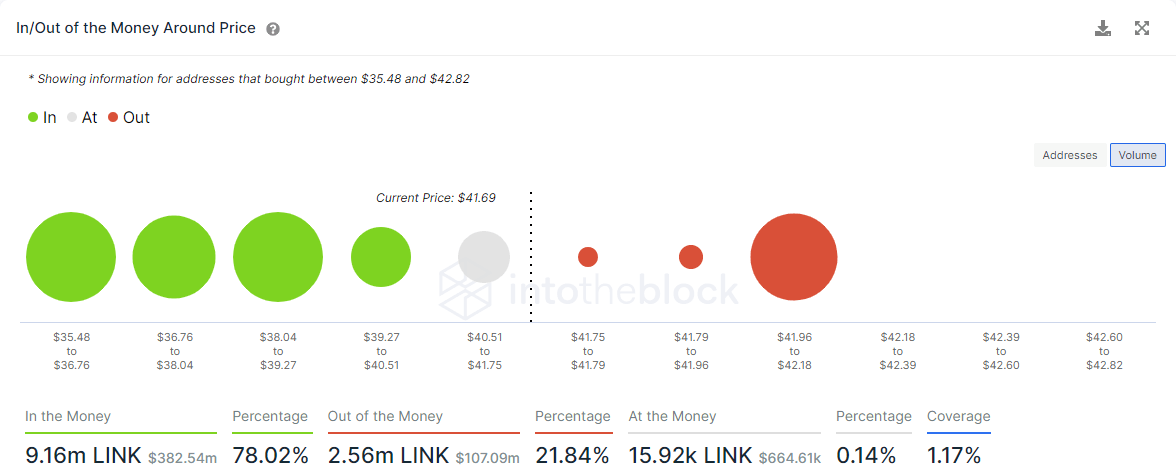
LINK IOMAP chart
LINK has been the beneficiary of a stronger cryptocurrency complex in April and a series of new developments for the blockchain that will continue to propel higher in the list of market capitalizations. Before that continues, the altcoin should consolidate the near 40% gain before making a second attempt to overcome the topside trendline resistance, currently at $44.20.
The consolidation process needs to hold above the 38.2% retracement of the rally off the February low at $35.44, but ideally, the February 20 high at $36.92 should contain the selling.
Upside targets include the 161.8% extension of the February correction at $46.76 and then the 361.8% extension of the August-September 2020 correction at $53.22.
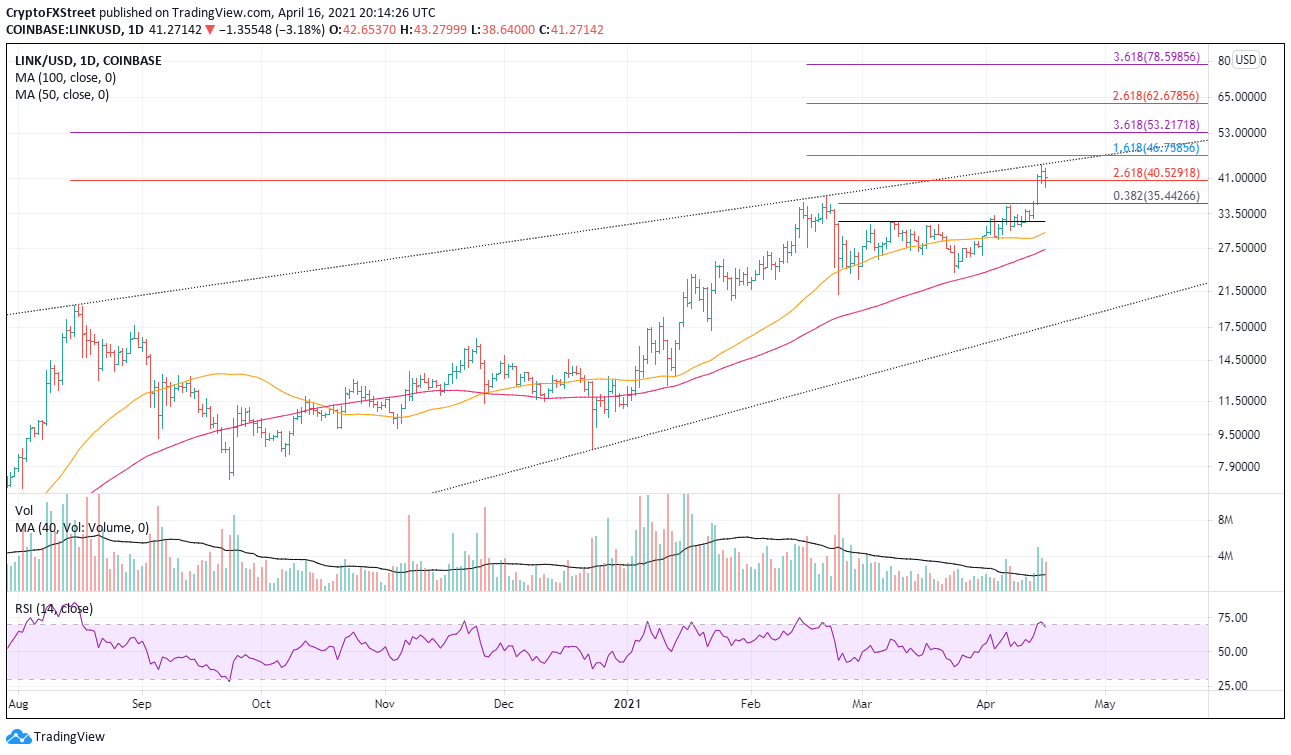
LINK/USD daily chart
The bearish momentum divergence of the RSI with price at February’s high and this month’s high raises concern over whether LINK can commit to higher prices moving forward.
Author

Sheldon McIntyre, CMT
Independent Analyst
Sheldon has 24 years of investment experience holding various positions in companies based in the United States and Chile. His core competencies include BRIC and G-10 equity markets, swing and position trading and technical analysis.


