Chainlink Elliott Wave technical analysis [Video]
![Chainlink Elliott Wave technical analysis [Video]](https://editorial.fxsstatic.com/images/i/CHAINLINK.png)
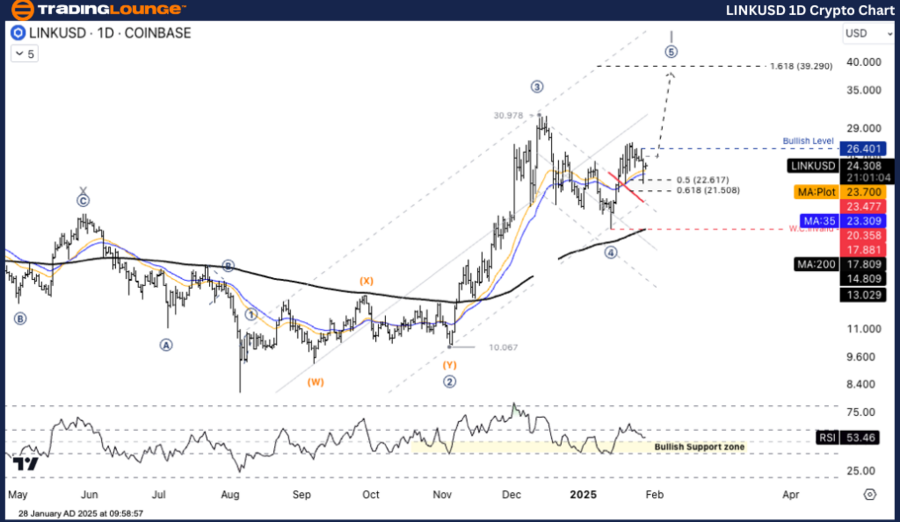
LINK/USD Elliott Wave technical analysis
-
Function: Follow Trend.
-
Mode: Motive.
-
Structure: Impulse.
-
Position: Wave ((5)).
-
Next higher degree direction: Wave I of Impulse.
-
Wave cancel invalid level: $17.88.
-
Details: The target for Wave (5) is projected near $39.29, based on the Fibonacci 1.618 extension of previous waves. This aligns with standard Wave V expectations in Elliott Wave Theory.
Elliott Wave analysis trading lounge daily chart, 28 January 2025
LINK/USD trading strategy
LINK/USD is currently at the start of Wave (5), maintaining a clear uptrend. If the price remains above the key support level and breaks the resistance at $30.978, it could initiate a long-term uptrend. Traders should monitor wave structures and critical price levels closely to adjust their strategies.
Trading strategies
-
If ETH sustains support at $2,899.73 and signals a reversal, it would confirm the end of Wave II.
-
Consider buying within the correction range of $22.617–$21.508, but only upon receiving a clear reversal signal.
-
Set a short-term profit target of $30,000 and a long-term profit target of $39,290.
-
Place a Stop Loss below $20.358 to guard against potential structural changes in the wave pattern.
LINK/USD Elliott Wave Technical Analysis
-
Function: Follow Trend.
-
Mode: Motive.
-
Structure: Impulse.
-
Position: Wave (2).
-
Next higher degree direction: Wave ((5)).
-
Wave cancel invalid level: Not specified.
-
Details: A breakout above $26.40 would confirm the beginning of Wave (3) within Wave ((5)), supporting a bullish trend.
Elliott Wave analysis trading lounge four-hour chart, 28 January 2025

LINK/USD trading strategy
LINK/USD remains in the early stages of Wave (5) with a strong upward trajectory. Should the price maintain above the key support and surpass the resistance level of $30.978, the long-term uptrend will likely persist. Keep tracking wave structures and levels to refine your trading approach.
Trading strategies
-
If ETH sustains support at $2,899.73 and indicates a reversal, it would signal the completion of Wave II.
-
Look to buy within the correction range of $22.617–$21.508, waiting for a confirmed reversal.
-
Aim for a short-term profit target of $30,000 and a long-term target of $39,290.
-
Place a Stop Loss below $20.358 to mitigate risks tied to wave structure changes.
Chainlink Elliott Wave technical analysis [Video]
Author

Peter Mathers
TradingLounge
Peter Mathers started actively trading in 1982. He began his career at Hoei and Shoin, a Japanese futures trading company.


