Celsius Technical Analysis: CEL bullish case unstoppable, targeting $2
- Celsius enters price discovery mode as it trades at all-time highs.
- The RSI suggests that the uptrend could soon hit pause, but bulls still have their eyes fixated on $2.

Celsius has arguably been the best-performing digital asset in the last week. Its growth has been very consistent from the beginning of September when the token exchanged roughly at $0.4. At the time of writing, CEL is trading at $1.42, following the 9.4% in gains accrued over 24 hours. Besides, the token has made it into the top 50 and has a market cap of $341 million.
Celsius capitalizing on DeFi
The decentralized finance (DeFi) craze took crypto by storm in 2020. While significant cryptocurrencies stalled, emerging projects received massive attention from investors. The DeFi sector offers access to finance from anywhere in the world. People can provide liquidity for lending platforms and earn interest. Moreover, these platforms offer staking, collateralized loans, and other financial services in the cryptocurrency industry.
Celsius is a project that provides “a platform of curated services that have been abandoned by big banks – things like fair interest, zero fees, and lightning-quick transactions.” Users have the opportunity to earn interest on their CEL holdings, Tether (USDT), Bitcoin (BTC) and Tether Gold. Celsius offers loans to its users at lower interest rates in addition to payment and transfer services.
Celsius rocketing its way to the moon
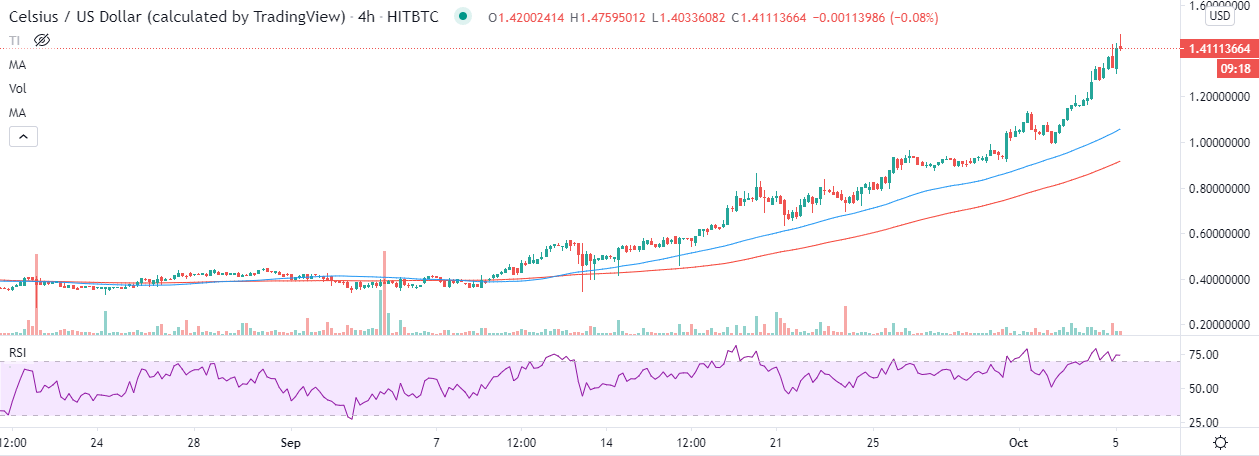
The DeFi token has rallied consistently over the last 30 days. The 50 Simple Moving Average has functioned as crucial support during this period. Instances of retracements have also been experienced but have not been big enough to delay the rally.
For instance, at the time of writing, CEL/USD is doddering at $1.42 after the uptrend hit pause at $1.47. The Relative Strength Index (RSI) has slowed movement heading to the overbought area. In other words, buying pressure is decreasing while selling pressure rises. However, the low volume in Celsius’ market hints that only minor damages can be done to the uptrend. Besides, the gap made by the 50 SMA above the 100 SMA in the 4-hour timeframe implies that buyers have more influence.
CEL/USD 4-hour chart
IntoTheBlock IOMAP model suggests that Celsius is in price discovery mode. In other words, it is exchanging hands at an all-time high. For this reason, the crypto has no defined resistance ahead. However, the chart highlights the most significant support between $1.17 and $1.18. Here, five addresses previously bought approximately 1.3 million CEL.
Celsius IOMAP chart
-637374830952127626.png)
The “New Daily Addresses” metric by IntoTheBlock also highlights a gradual increase in the number of new addresses joining the network. Since September 4, new addresses coming into the network have formed a higher low pattern to the extent of hitting 362 by October 3. The price can be seen rallying in tandem with the addresses. Therefore, if the surge continues, the price discovery mode will likely hit higher levels towards $2.
Celsius new addresses chart
-637374830468133851.png)
Looking at the other side of the fence
Celsius is trading at its all-time high. It is difficult to tell how far the uptrend will go at the moment. If the number of new addresses starts to reduce, there is a chance the CEL will hit a stumbling block. On the downside, support lies at the 50 SMA in the 4-hour timeframe, while losses under $1 will seek refuge at the 100 SMA.
Author

John Isige
FXStreet
John Isige is a seasoned cryptocurrency journalist and markets analyst committed to delivering high-quality, actionable insights tailored to traders, investors, and crypto enthusiasts. He enjoys deep dives into emerging Web3 tren



