|

Cardano price primed for ultimate upswing to $3.40 before profit-taking

  • Cardano was in a perfect triangle aiming upwards.
  • Buyers jumped the gun and tried to break the base earlier with regained sentiment in the markets.
  • It will be vital that price action closes above $3.04 on the daily chart.

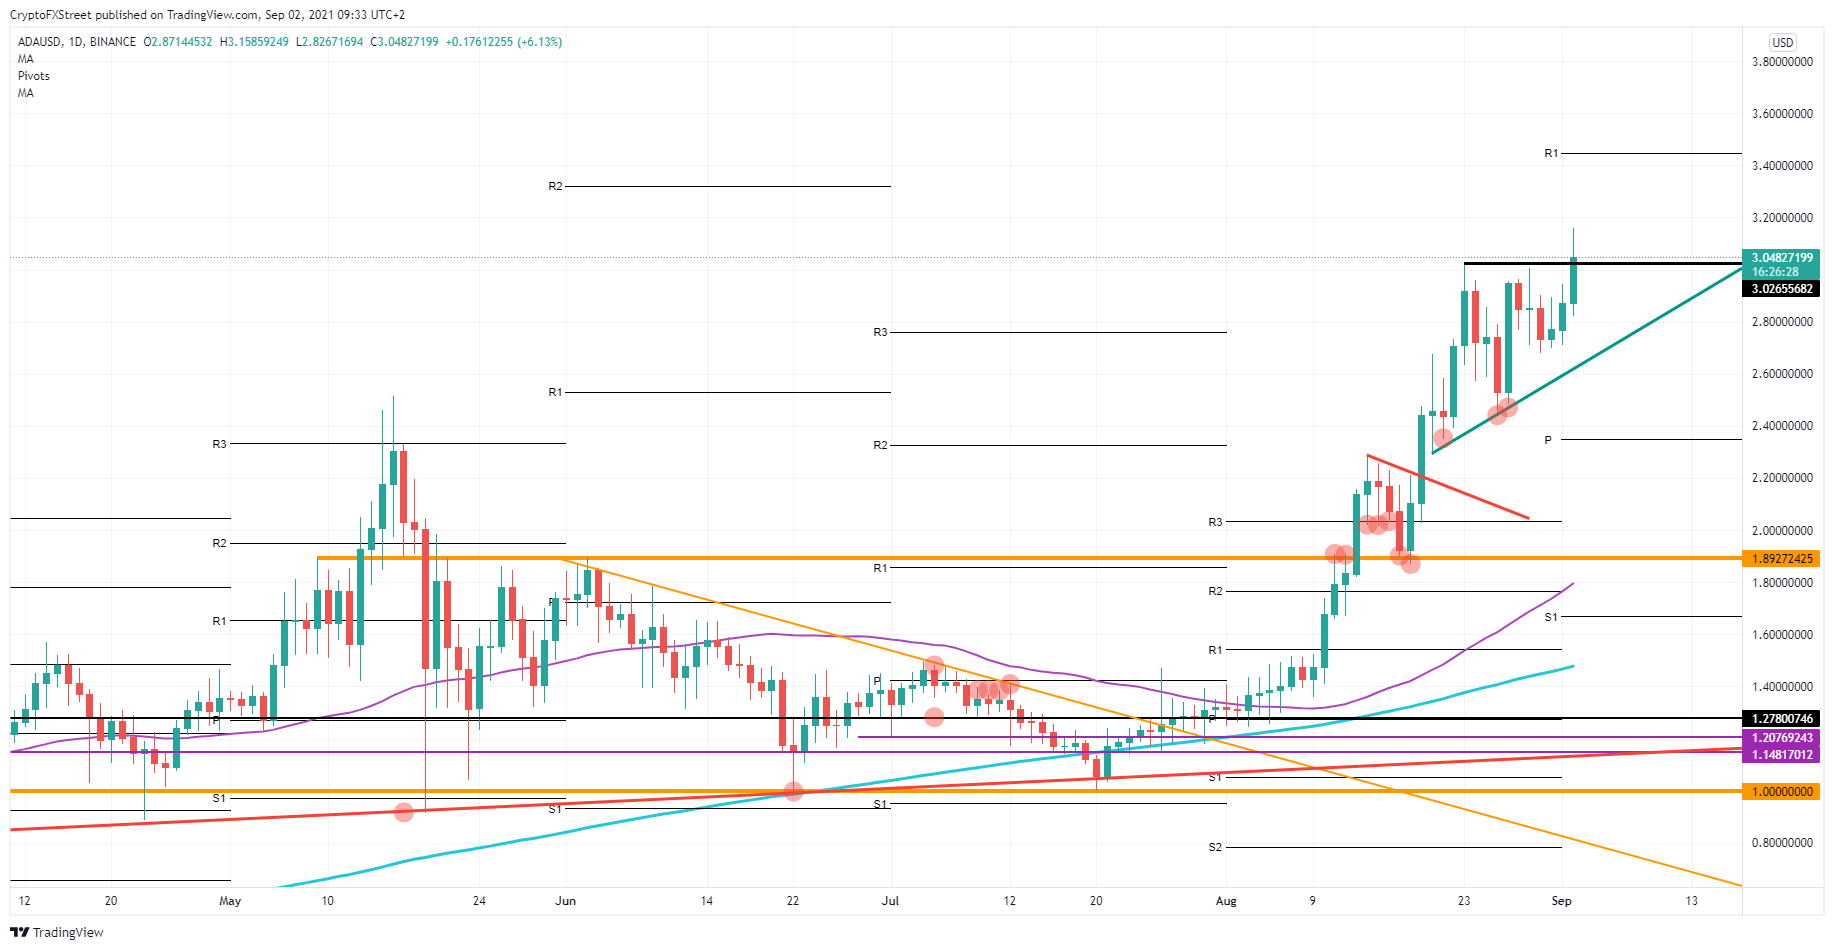
Cardano (ADA) has been in a bullish triangle since August 20. The ascending green trend line of that triangle got confirmed three times during the life cycle of the triangle, demonstrating the importance of the trend line. Upwards, for the flat baseline, $3.04 got tested once on August 29. Price retreated quickly the day after, however, showing that short-term profit was taken and that sellers have this level marked up as a good entry point for them.

Cardano still has excellent upside potential

The reason for this possible bull trap unfolding comes from two reasons. The first reason is the way buyers gained control. The green ascending trend line from July 20 was chopped up on August 30 and did not look very proper as an entry point. One good element to remember is that SHIB could push above the 55-day Simple Moving Average (SMA). But the risk to the upside is the triple belt of resistance hanging over the current price action.
ADA/USD daily chart

ADA/USD daily chart

A daily close above $3.04 is so important, because this will attract more buyers into the trade. The $3.04 level will then turn into support and act as a jumping point toward $3.40. 

If we do not get a daily close, this could indicate that there has been too much profit-taking and that the trade is weakening. Sellers will try to push price action toward the green ascending trend line of the triangle again. A break lower could push ADA to $2.30. That is the level where the triangle started, and just above there is the monthly pivot at $2.35.

Author

Filip Lagaart

Filip Lagaart is a former sales/trader with over 15 years of financial markets expertise under its belt.

More from Filip Lagaart
Share:

Editor's Picks

Bitcoin Weekly Forecast: BTC retreats as macro headwinds grow
Bitcoin (BTC) remains under pressure, down over 4% this week and trading around $76,900 at the time of writing on Friday. Institutional demand shows signs of weakness as spot BTC Exchange Traded Funds (ETFs) are on track to end their three-week inflow streak, recording nearly $500 million in net outflows through Thursday.
XRP falls toward key support as macro uncertainty, weak momentum cap recovery
Ripple (XRP) falls below $1.33 on Friday, marking the third consecutive day of declines. The token continues to track the broader cryptocurrency market downturn, with investors closely monitoring heightened macroeconomic uncertainty ahead of the United States (US) Consumer Price Index (CPI) release and next week’s Federal Reserve (Fed) monetary policy decision.
Crypto Today: Bitcoin, Ethereum, XRP stabilize at lower levels amid ETF outflows and macroeconomic risks
The broader cryptocurrency market is rising on Friday, with Bitcoin (BTC) trading above $77,000 after testing lower support near $76,500. Ethereum (ETH) shows signs of stability, hovering above the support provided at $2,400 despite capped upside at $2,500. Meanwhile, Ripple (XRP) holds above $1.33 after three straight days of declines, reflecting growing headwinds due to macroeconomic uncertainty.
Bitcoin pulls back as another golden cross fails to deliver
Earlier this week, Bitcoin formed a golden cross, a technical signal that occurs when the price’s 50-day moving average rises above the 200-day moving average and is conventionally viewed as a precursor to a bullish rally. Historically, however, that’s often not been the case.
Bitcoin: BTC retreats as macro headwinds grow
Bitcoin (BTC) remains under pressure, down over 4% this week and trading around $76,900 at the time of writing on Friday. Institutional demand shows signs of weakness as spot BTC Exchange Traded Funds (ETFs) are on track to end their three-week inflow streak, recording nearly $500 million in net outflows through Thursday.

