- Cardano price rises to a new monthly high at $0.389.
- ADA Is currently in an uptrend, but the technicals display mixed signals.
- A breach of $0.367 could become the catalyst of a larger decline.
Cardano price points higher but faces resistance in the process. Key levels have been defined to gauge ADA’s potential price trajectory in the coming days.
Cardano price presents a challenge
Cardano price continues to display bullish technicals as a new monthly high at $0.389 has been established on January 26. The 4% rise on the day brings Cardano’s total uptrend to a 60% rally since the start of the new year.
Cardano price currently auctions at $0.380. The recent uptick has enabled a hurdle above the 8-day exponential moving average. Still, bulls looking to join the trend should be cautious as the ADA price faces resistance from November's broken support zone at $0.39.
With such a small spread between key levels, traders may also want to adopt a trade-by-trade basis to avoid a larger backlash into lower support zones. The psychological $0.40 level will likely have an impact on the ADA price as well. The bullish scenario creates a potential 6% upswing from Cardano's current market value.
The Relative Strength Index, an indicator used to gauge the influence of market participants by comparing and contrasting previous rallies, shows mixed signals.
For instance, the bullish narrative on the RSI suggests Cardano is in a healthy uptrend because it has breached overbought territory past 80 and is producing higher highs above the previous resistance zone.
The bearish narrative however, shows a divergence between each ascending pivot point from $0.340, $0.375 and the new high at $0.389. Bearish divergence usually means an uptrend is due for a correction. If this is the case, the ADA price could fall as low as $0.28 towards the ascending trend channel that aided the initial stages of the 60% rally. The downside risk is 22% below Ada's current market value.
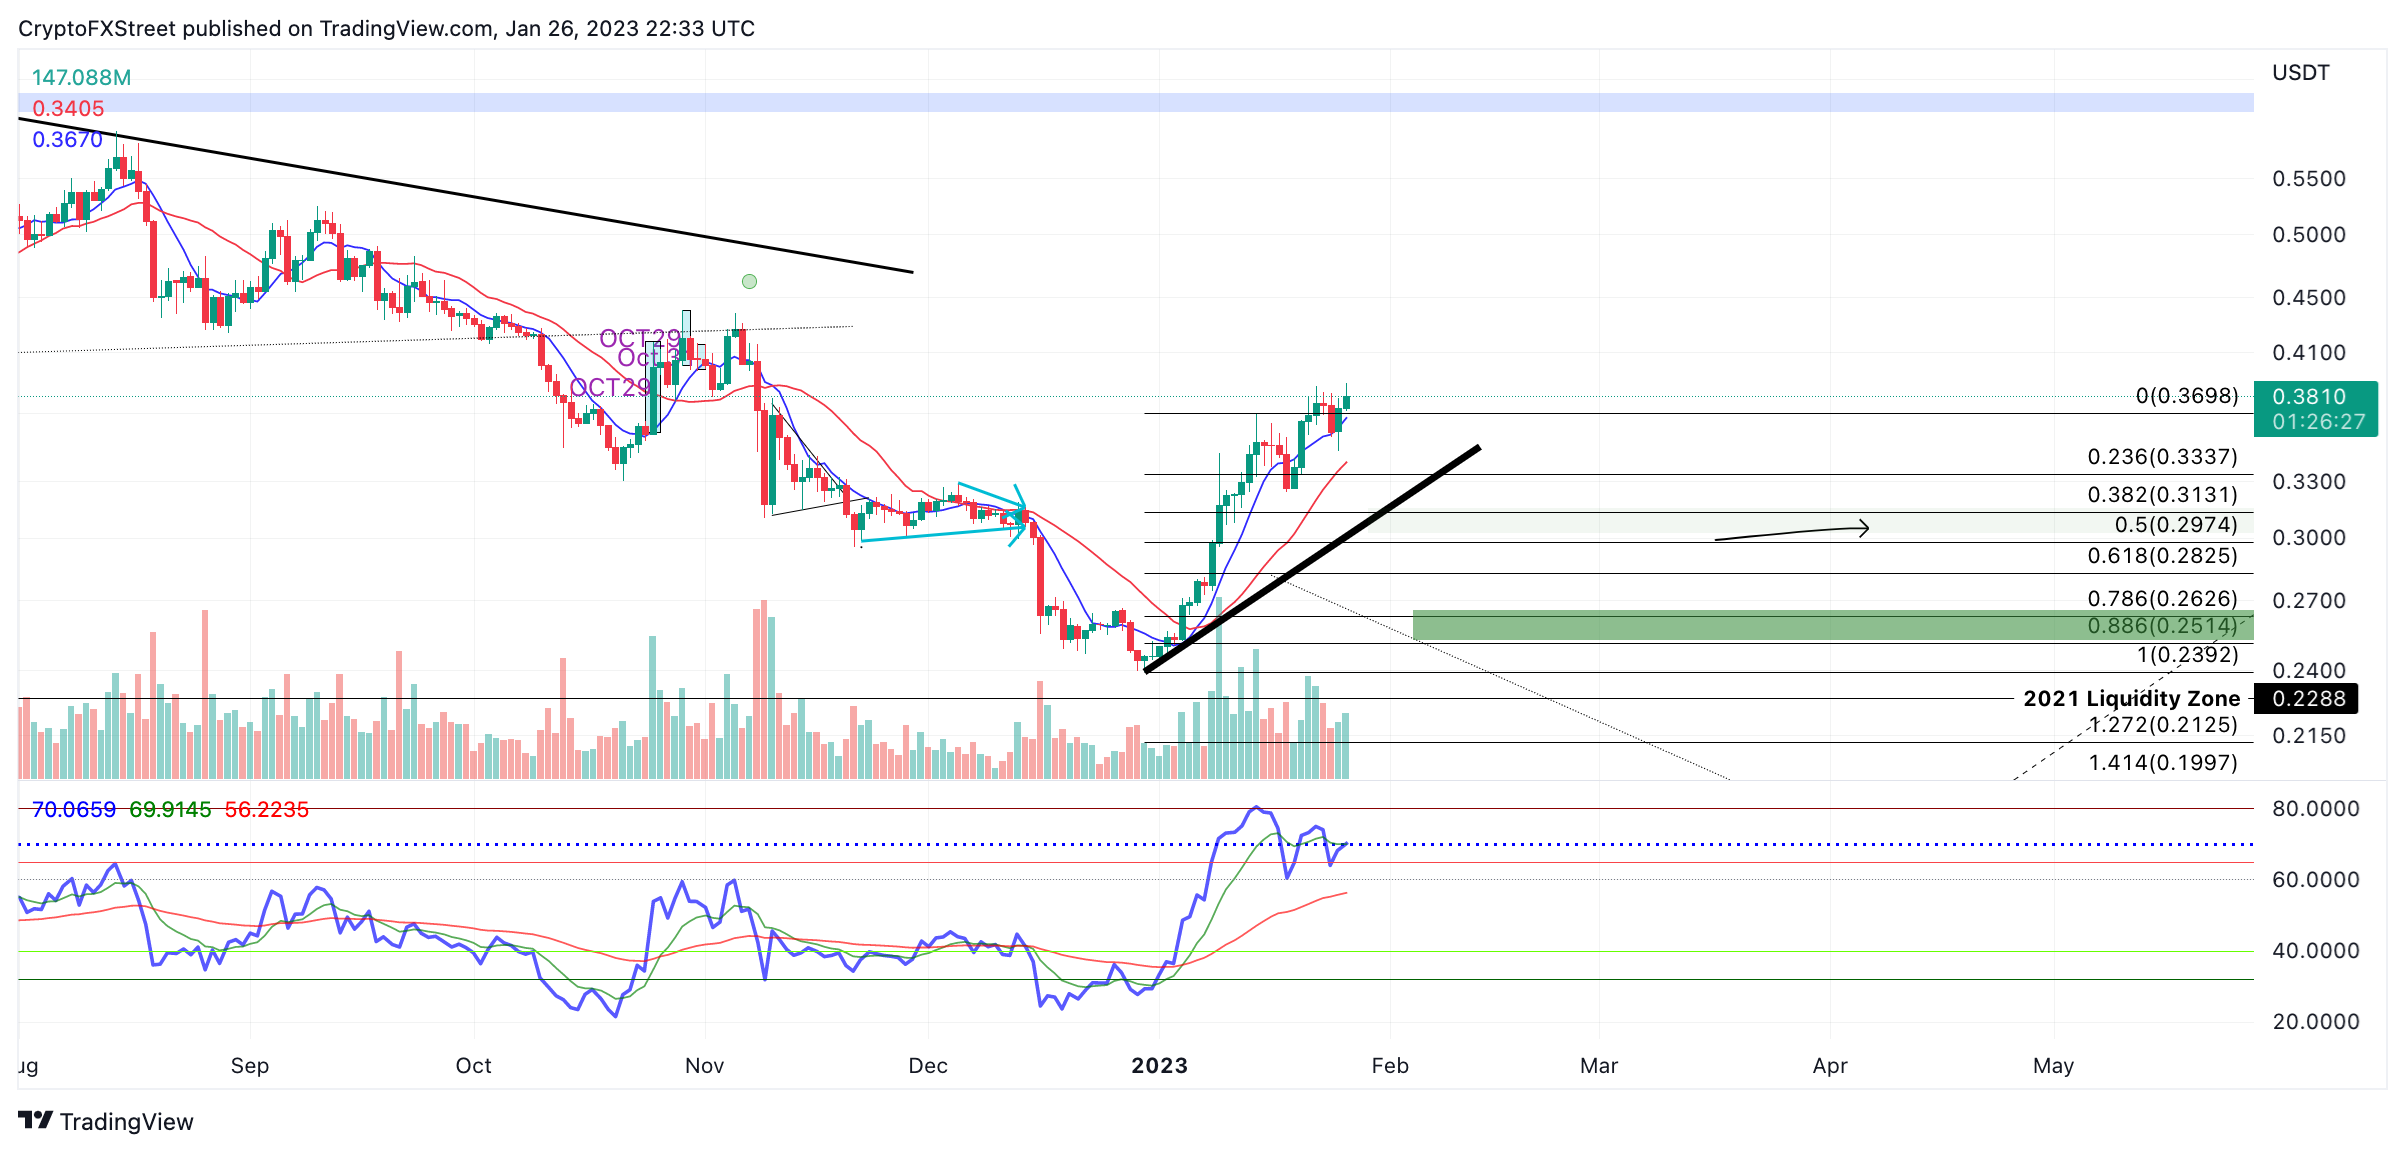
ADA/USDT 1-Day Chart
Considering these factors, risk management should be applied with a keen focus on detail. A second attempt at the 8-day exponential moving average at $0.367 could be the early stages of the anticipated decline.
Information on these pages contains forward-looking statements that involve risks and uncertainties. Markets and instruments profiled on this page are for informational purposes only and should not in any way come across as a recommendation to buy or sell in these assets. You should do your own thorough research before making any investment decisions. FXStreet does not in any way guarantee that this information is free from mistakes, errors, or material misstatements. It also does not guarantee that this information is of a timely nature. Investing in Open Markets involves a great deal of risk, including the loss of all or a portion of your investment, as well as emotional distress. All risks, losses and costs associated with investing, including total loss of principal, are your responsibility. The views and opinions expressed in this article are those of the authors and do not necessarily reflect the official policy or position of FXStreet nor its advertisers. The author will not be held responsible for information that is found at the end of links posted on this page.
If not otherwise explicitly mentioned in the body of the article, at the time of writing, the author has no position in any stock mentioned in this article and no business relationship with any company mentioned. The author has not received compensation for writing this article, other than from FXStreet.
FXStreet and the author do not provide personalized recommendations. The author makes no representations as to the accuracy, completeness, or suitability of this information. FXStreet and the author will not be liable for any errors, omissions or any losses, injuries or damages arising from this information and its display or use. Errors and omissions excepted.
The author and FXStreet are not registered investment advisors and nothing in this article is intended to be investment advice.
Recommended Content
Editors’ Picks
Bitcoin likely to remain in red through the next quarter if history is any indication

Bitcoin (BTC) price produced a monthly close at $27,210, noting a -6.92% return for May. The last-minute slide in BTC put an end to the four-month bullish streak that kickstarted the 2023 rally.
Ethereum vs. SEC: Implications of Wahis’ insider trading settlement on ETH

Ethereum (ETH) is the subject of a new controversy, with the second-largest crypto finding itself in the rut after the United States Securities and Exchange Commission (SEC) settled its insider trading case against the Wahi brothers.
Justin Sun’s TRON hits all-time high of 10.9M daily transactions, braving crypto winter

Justin Sun, the founder of TRON – one of the largest decentralized blockchain DAO ecosystems in crypto – shared a new milestone for the token on Thursday. TRON processed 10.9 million in daily transactions, hitting a record high.
Ethereum fees decline by 70% from 2023 highs as top DeFi protocols lose users

Ethereum is currently facing trouble in the spot market due to the broader market bearishness as well as investors' skepticism. But while the spot market only recently took a turn for the worse, the DeFi space has been only negative for a long time.
Bitcoin: BTC delays inevitable crash to $25,000

Bitcoin price is delaying a crash that has been brewing for roughly two weeks. A failure to push higher could result in a steep correction next week. The troubling macroeconomic conditions could be key in catalyzing and trigger a nosedive for BTC holders.