Cardano Price Prediction: ADA confirms start of 80% upswing
- Cardano price shows signs of a massive bounce.
- Bollinger Bands indicator confirms a volatile move as it tightly envelops ADA.
- MRI’s State Trend Resistance at $1.34 and flat supply barrier at $1.46 are two critical hurdles.

The Cardano price is primed for a massive bull run based on multiple technical indicators.
Cardano price looks to make record highs again
The Cardano price has been on a tear this bull run. However, it slid into consolidation after setting up an all-time high at $1.54 on February 27. Since then, ADA has formed higher lows while being restricted by a horizontal resistance at $1.49.
By connecting these swing lows and series of highs using trend lines, an ascending triangle forms. This technical formation is a continuation pattern and projects a 45% upswing, determined by measuring the pivot high and low distance.
Adding this measure to the breakout point at $1.49 yields the Cardano price target at $2.18.
ADA confirmed buyers’ resurgence at the time of writing as it bounced off the technical formation’s inclined trend line. This area approximately coincides with the 50 and 100 Simple Moving Averages (SMA) at $1.18 and $1.14, which serve as stable support barriers.
A continuation of this bullish momentum will push the Cardano price to encounter the Momentum Reversal Indicator’s State Trend Resistance at $1.34, which is a significant level that needs to be overcome. Following this, ADA bulls must produce a decisive close above $1.49 on the 12-hour chart to trigger a 45% upswing.
Assuming a swift move, the so-called “Ethereum killer” could potentially surge 80% from its current price to hit the intended target at $2.18.
Adding credibility to this enormous run-up is the Bollinger Bands indicator that has squeezed the Cardano price to trade between the upper and the lower bands. This phase indicates a period of reduced volatility and confirms that a highly volatile move will ensue.
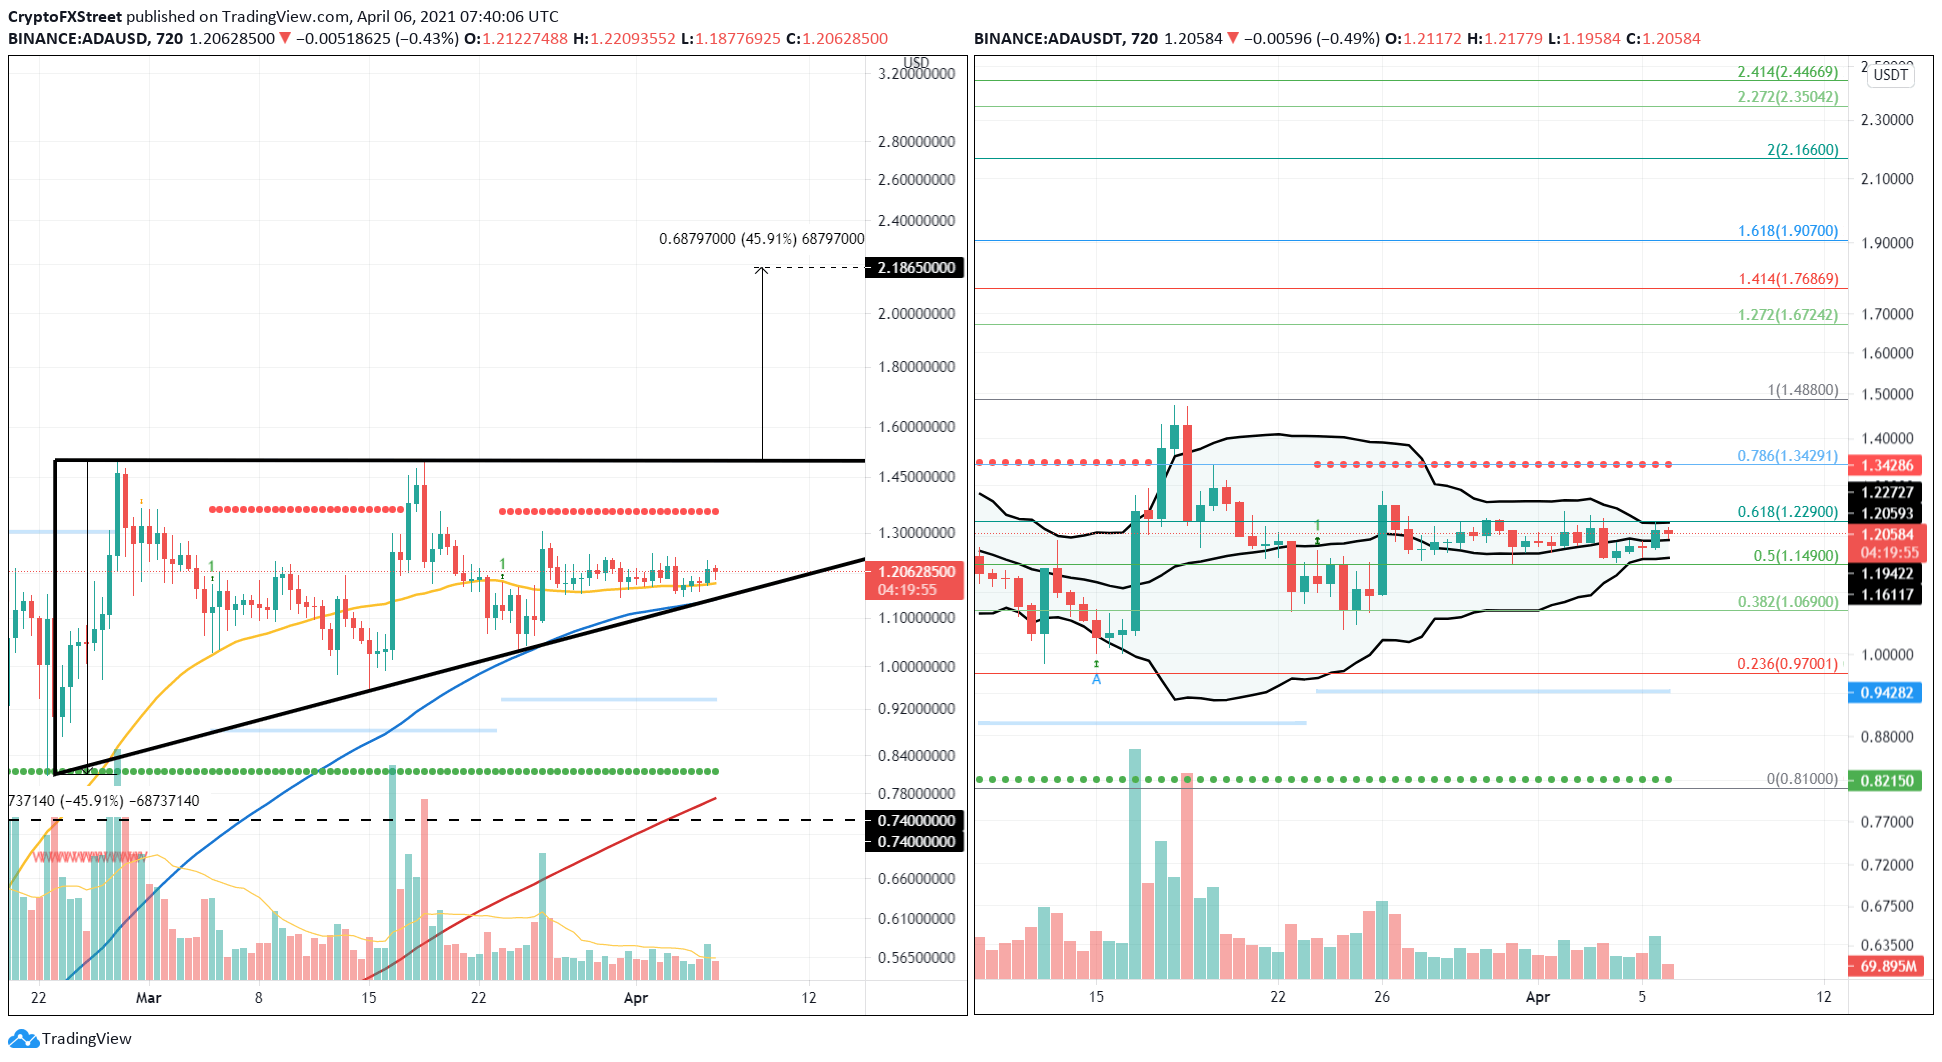
ADA/USDT 12-hour chart
Supporting the upside move is IntoTheBlock’s In/Out of the Money Around Price (IOMAP) model, which shows a cluster of small “Out of the Money” investors at $1.33. Here roughly 65,000 addresses previously purchased 1.32 billion ADA.
Moreover, the Cardano price level ranging from $1.15 to $1.26 has seen 350,000 addresses purchase a whopping 8.56 billion ADA. This development shows accumulation underway further supporting the volatile move.
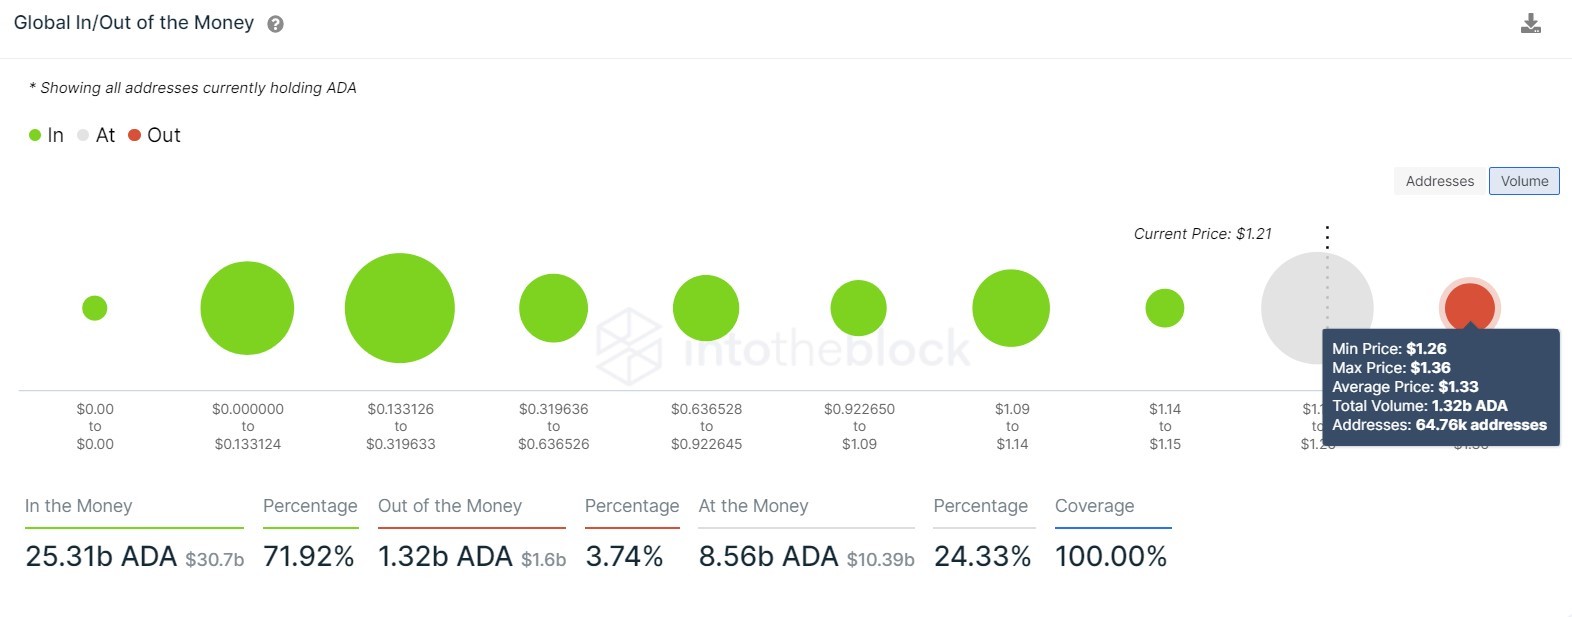
Cardano GIOM chart
Regardless of the optimism, a spike in selling pressure that pushes the Cardano price below $1.02 for an extended period will invalidate the bullish outlook as it would create a lower low. This move would also signal the start of a new downtrend.
In such a scenario, ADA could fall 9% to the immediate demand barrier at $0.94.
Author

Akash Girimath
FXStreet
Akash Girimath is a Mechanical Engineer interested in the chaos of the financial markets. Trying to make sense of this convoluted yet fascinating space, he switched his engineering job to become a crypto reporter and analyst.



