Cardano Price must defend this point for a 12% upswing as network activity increases
- Cardano price is contained inside a descending triangle pattern on the 4-hour chart.
- The digital asset has experienced a massive surge in network activity in the past week.
- According to several indicators, there is only one key resistance ahead for ADA bulls.

Cardano has been trading in a downtrend for several days on the 4-hour chart, and the price is currently located at a key support level for the bulls. Despite the weak price action, Cardano has seen a massive spike in the number of new addresses joining the network.
Cardano price could see a massive breakout as on-chain metrics strengthen
On the 4-hour chart, Cardano price has formed a descending triangle pattern with a critical support level at $1.16. The digital asset must defend this point at all costs, and it seems that odds favor the bulls according to various indicators.
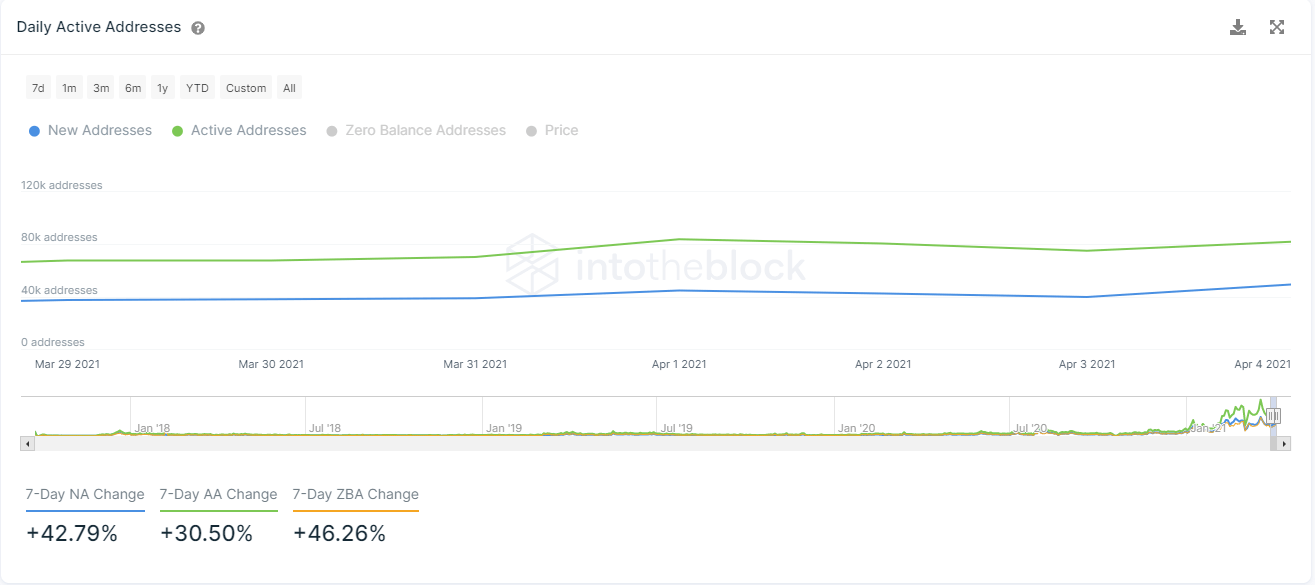
ADA Network Activity
The number of new addresses joining the Cardano network in the past week has increased by 43% despite the significant price decline the digital asset has experienced. Similarly, the amount of active addresses also increased by 30% in the same time period giving ADA buyers the upper hand.
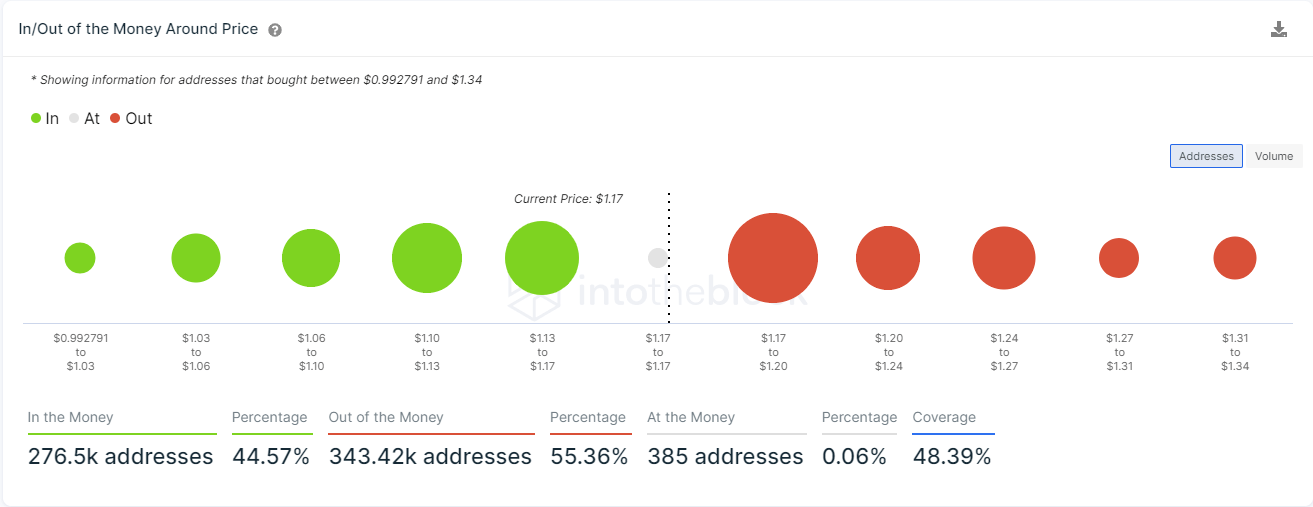
ADA IOMAP chart
The In/Out of the Money Around Price (IOMAP) chart shows one crucial resistance area between $1.17 and $1.20 with a volume of 4.6 billion ADA. This coincides with the upper resistance trendline of the descending triangle pattern.
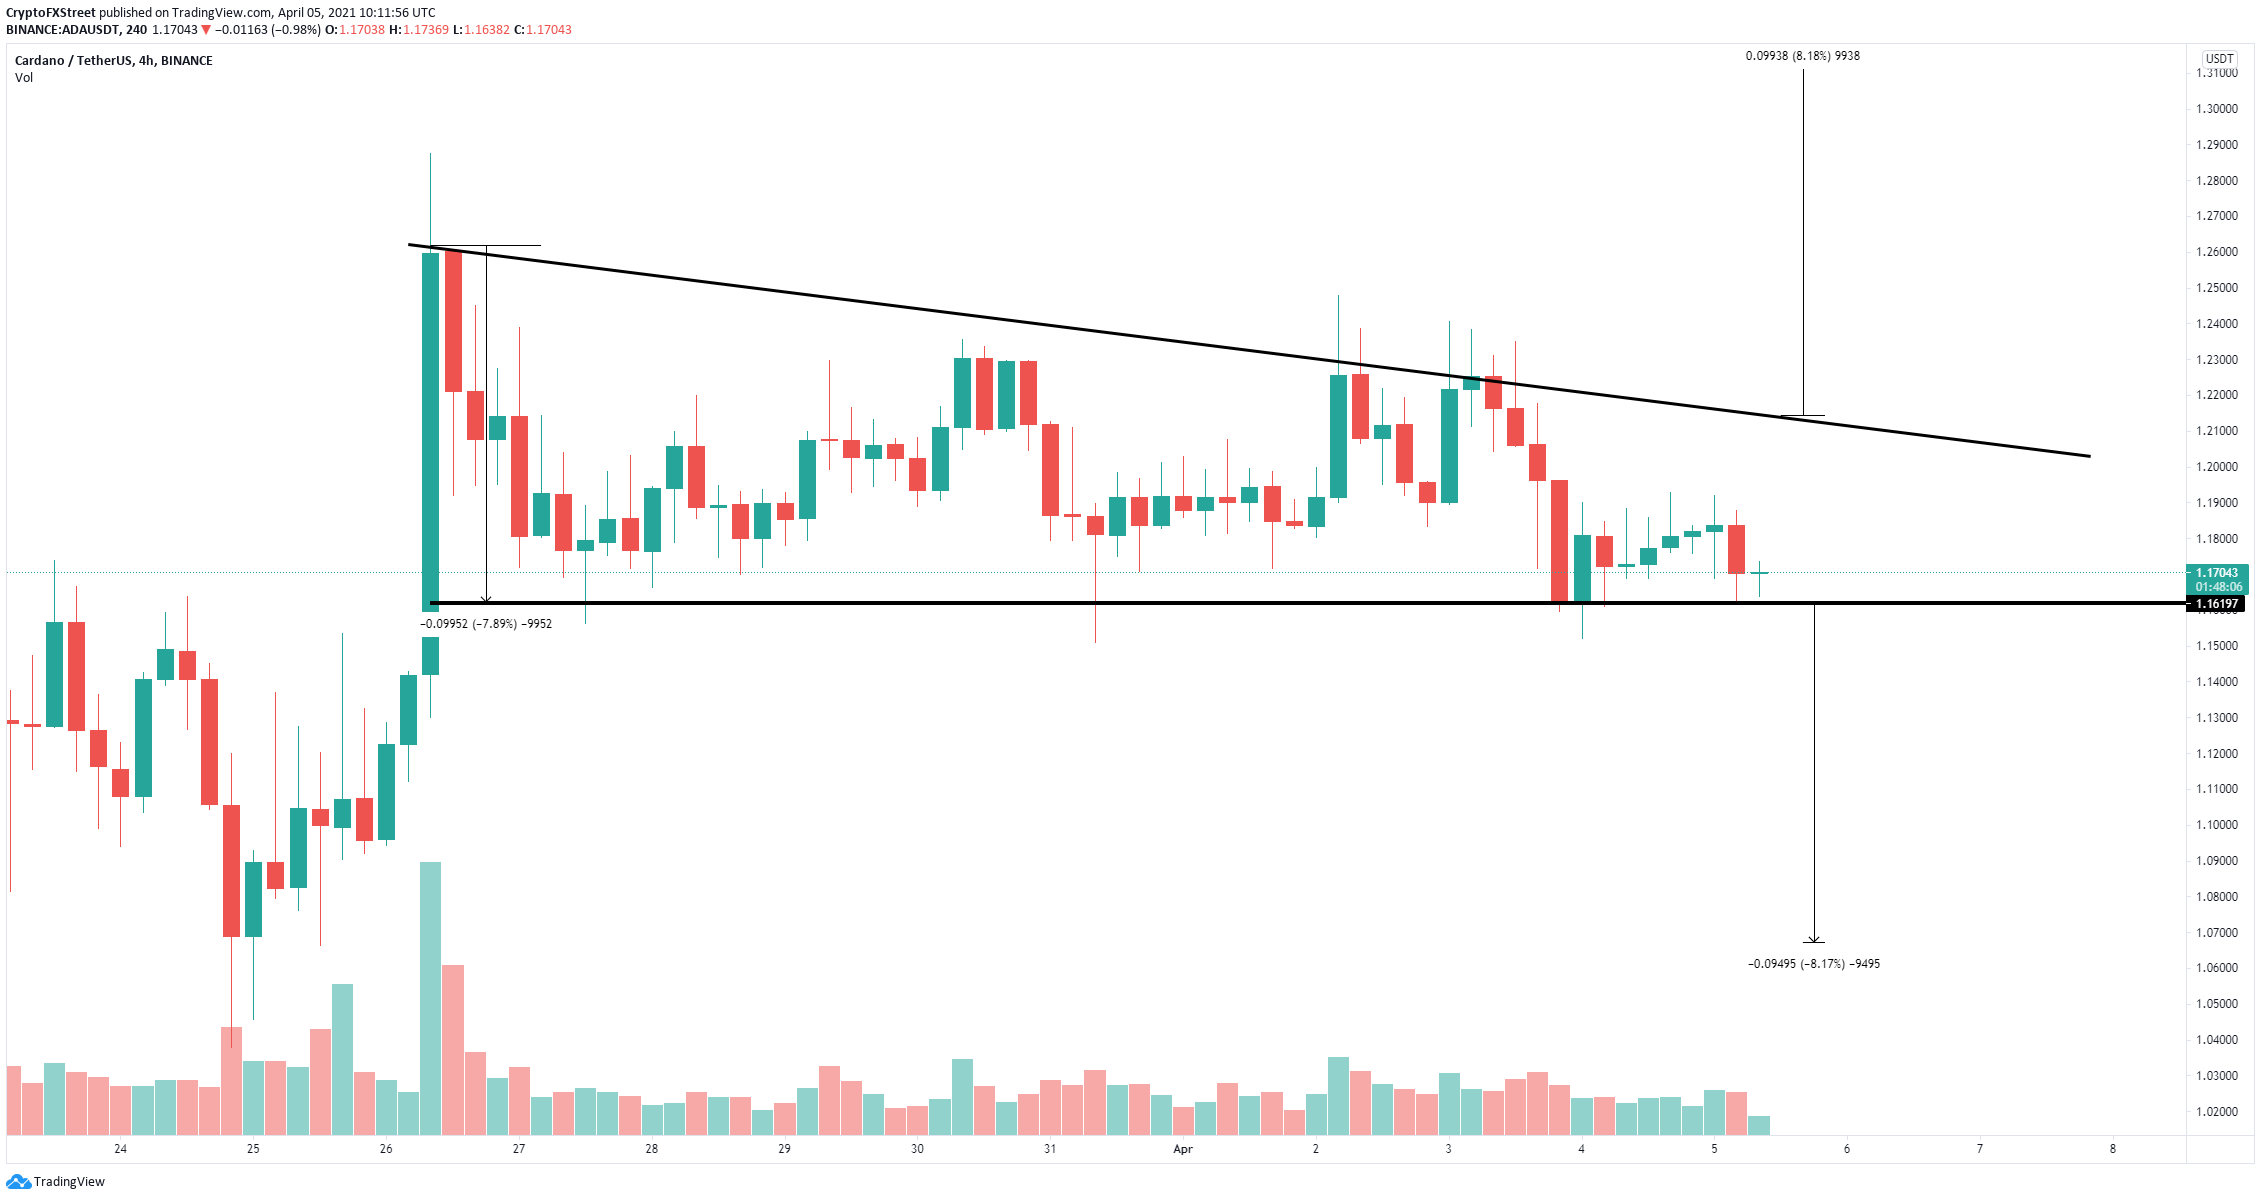
ADA/USD 4-hour chart
A breakout above the upper boundary would yield bulls an 8% upswing towards $1.31. This move is calculated using the height between the lower trendline and the upper boundary of the pattern as a reference.
On the other hand, failure to hold the key support level at $1.163 would quickly drive Cardano price towards $1.06.
Author

Lorenzo Stroe
Independent Analyst
Lorenzo is an experienced Technical Analyst and Content Writer who has been working in the cryptocurrency industry since 2012. He also has a passion for trading.


