|

Cardano price is on the verge of a massive move, suggests critical indicator

  • Cardano price is contained inside an ascending triangle pattern on the 4-hour chart, ready to burst.
  • The breakout or breakdown will most likely drive ADA by 30% in the long-term.

Cardano has been trading relatively sideways for the past four days consolidating from its 2020-high at $0.183. The digital asset seems to be ready for a massive price move as bears and bulls continue fighting.

Cardano is on the verge of a huge move, but in which direction?

It seems that Cardano has formed an ascending triangle pattern on the 4-hour chart which is extremely close to a breakout or breakdown. So far, the bulls have defended the 50-SMA as support which means they are strong.

ada price

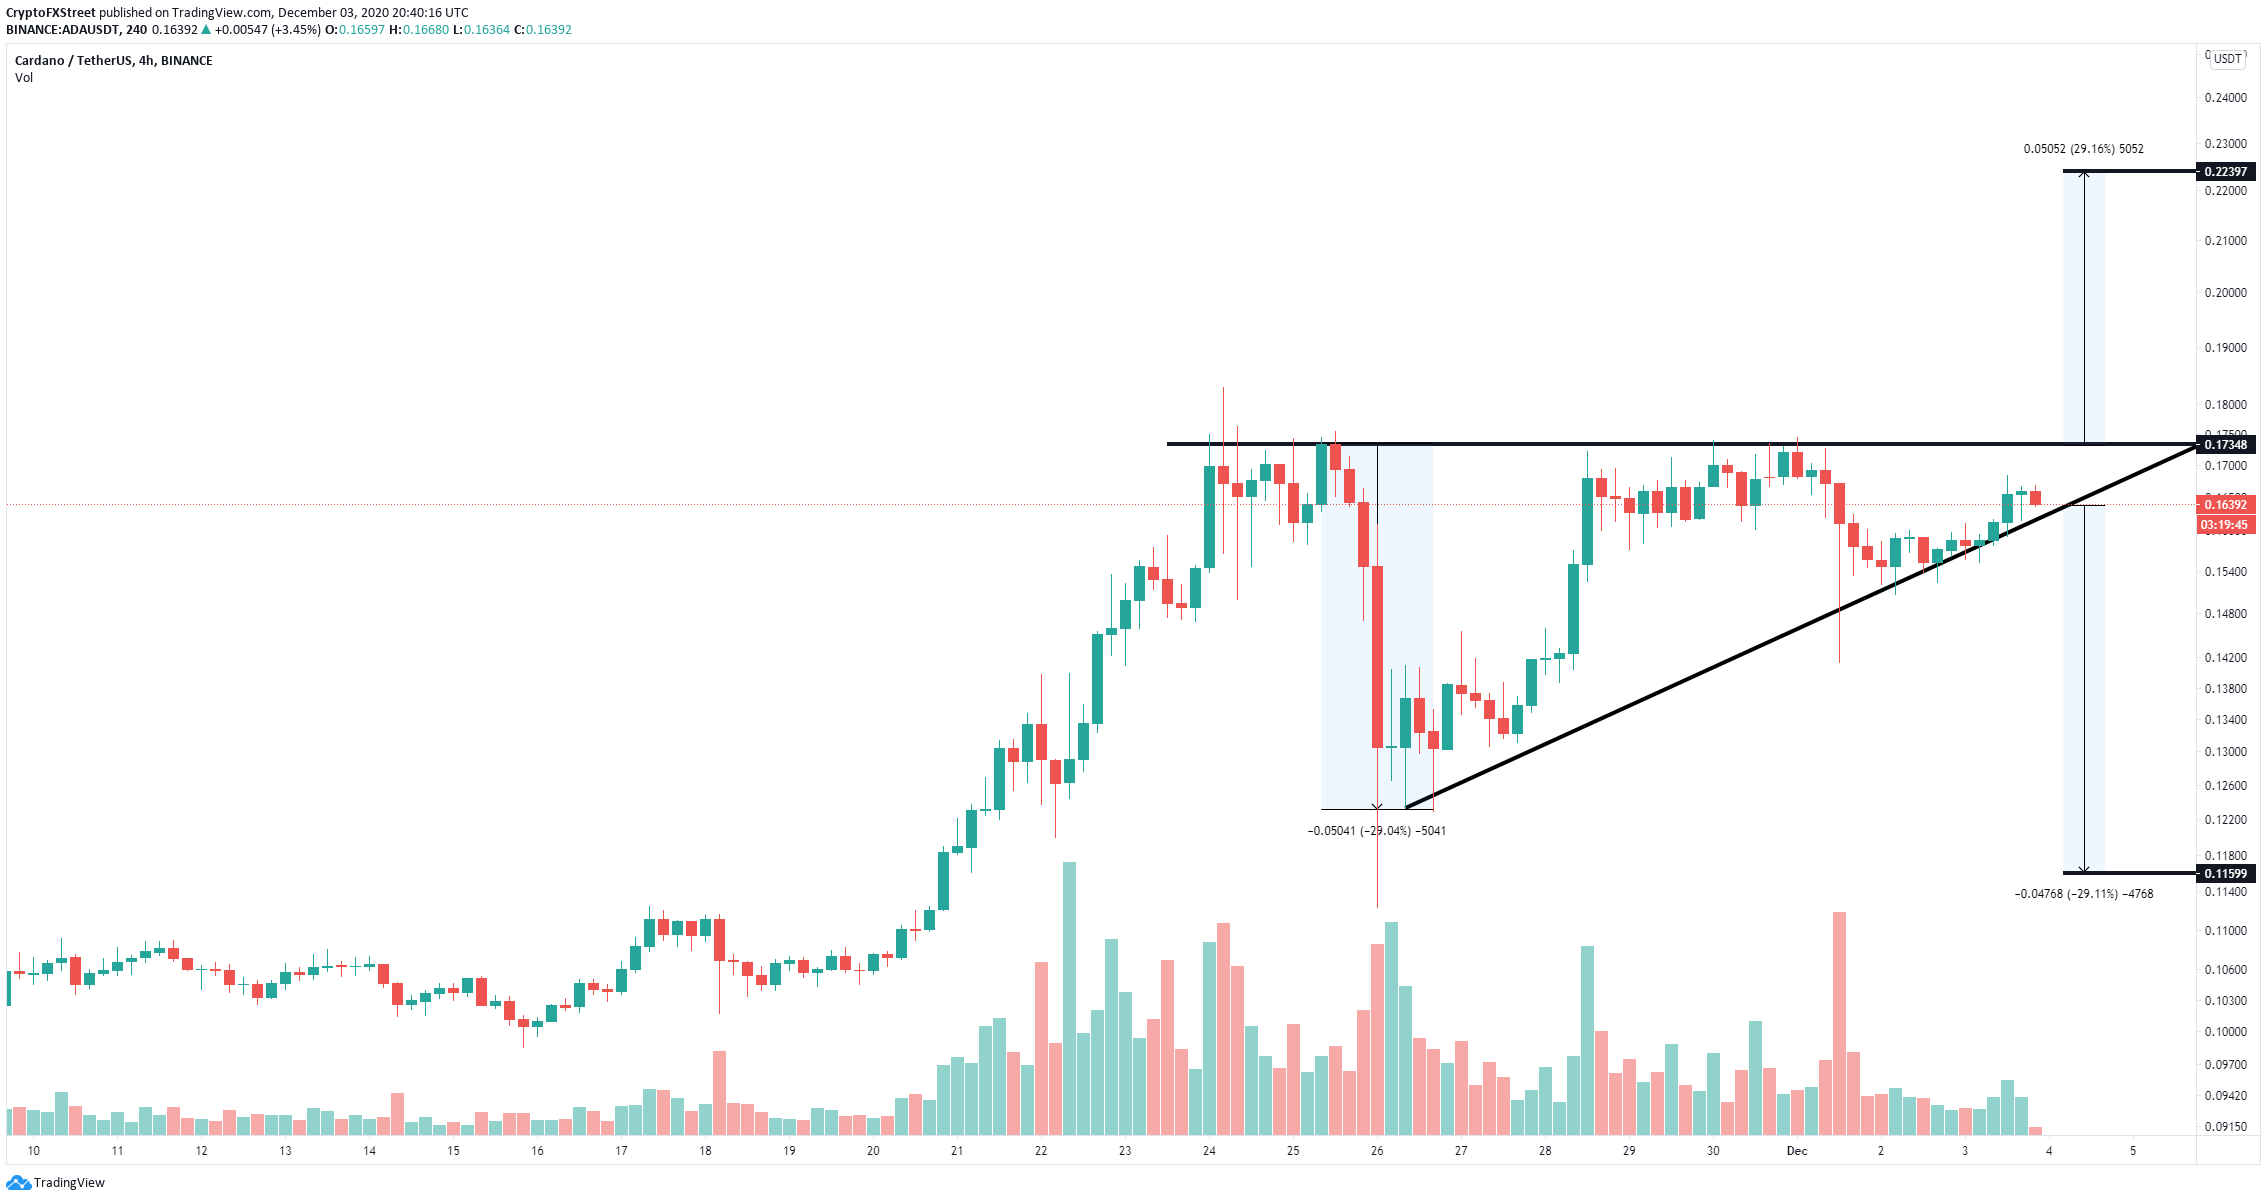
ADA/USD 4-hour chart

The In/Out of the Money Around Price chart (IOMAP) only shows one significant resistance area between $0.164 and $0.168, but the upper trendline of the pattern is at $0.173. This seems to indicate that climbing above $0.168 can quickly drive Cardano price to the upper boundary of the triangle and break out easily, targeting $0.223. 
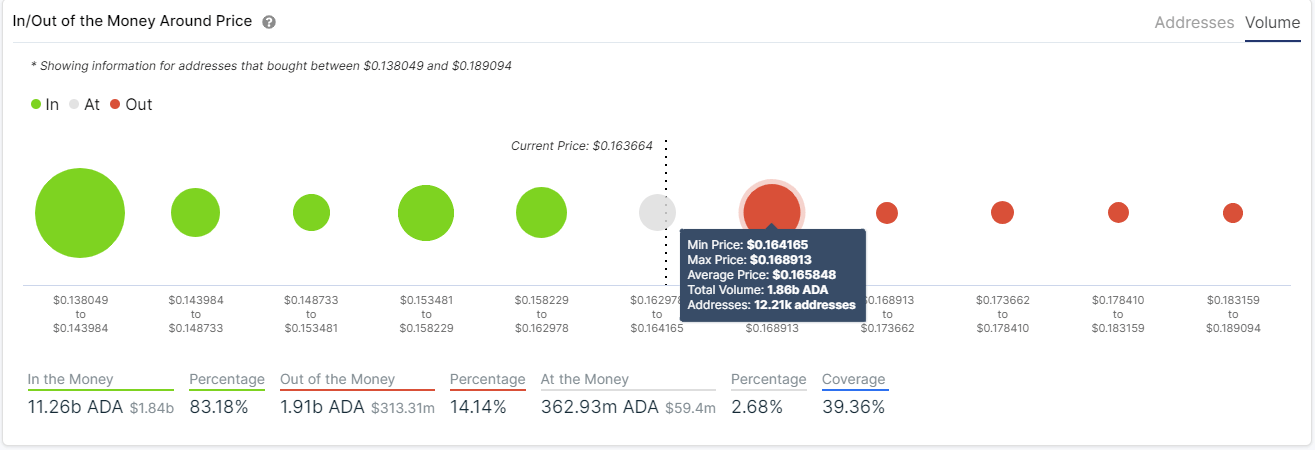
ada price

ADA IOMAP chart

On the other hand, the same chart also shows very little support on the way down and the current Cardano price at $0.163 is close to the lower boundary of the pattern. A breakdown below this point can push ADA price towards $0.115 in the long-term.

Author

Lorenzo Stroe

Lorenzo Stroe

Independent Analyst

Lorenzo is an experienced Technical Analyst and Content Writer who has been working in the cryptocurrency industry since 2012. He also has a passion for trading.

More from Lorenzo Stroe
Share:

Editor's Picks

Ripple technical weakness persists as selling intensifies toward $1.00

Ripple grinds lower, trading around $1.10 at the time of writing on Wednesday. The sticky bearish outlook mirrors the broader crypto market, with major coins such as Bitcoin and Ethereum facing weak demand as investors de-risk.

Crypto Today: Bitcoin, Ethereum, XRP face downside pressure amid investor de-risking

Major crypto assets trade under intense headwinds on Wednesday, as market participants navigate complex geopolitical and macroeconomic environments. Bitcoin has slipped toward $61,000 after its recent rebound was sold near $64,000, leaving buyers exhausted.

Bitcoin Price Forecast: Sticky inflation fears threaten deeper sell-off in BTC

Bitcoin extends its decline on Wednesday, trading below $61,500 at the time of writing as renewed US-Iran tensions keep the risk sentiment capped. In addition, persistent capital outflows from US-listed spot Exchange Traded Funds continue to fuel selling pressure on BTC.

Pi Network extends decline as CEX outflows fail to offset bearish pressure

Pi Network edges lower on Wednesday, extending its third consecutive day of losses. The technical outlook for PI is largely bearish, with a risk of a steeper correction below $0.1184.

Bitcoin: After the bloodbath, everyone looks at $60,000
Bitcoin (BTC) hovers above $62,000 at the time of writing on Friday, weighed down by growing risk-off sentiment due to persistent geopolitical tensions in the Middle East and sticky macroeconomic uncertainty. The institutional sell-off continued to wreak havoc on capital flows, with spot Bitcoin Exchange-Traded Funds (ETFs) recording billions in outflows.