Cardano price forming an explosive continuation pattern
- Cardano price closed last week with a Doji candlestick despite broader market weakness.
- Weekly Relative Strength Index (RSI) shows a head-and-shoulders top.
- Key moving average finally caught up to price.

Cardano price catapulted 9000% from the 2020 low to 2021 high, and the momentum carried the price beyond the all-time high set in January 2018. Over the last five weeks, ADA has been shaping a pennant pattern on the weekly chart.
Cardano price could run immediately
A classic pennant is preceded by a straight-up price trend and is short in duration. It is a frequent formation with extremely rapid and relatively reliable outcomes. Following a breakout, prices tend to move immediately, with few pullbacks or throwbacks in either direction.
If ADA shapes a pennant pattern, traders should be prepared for a sharp resolution over the next two weeks. Since the pattern is a continuation pattern, traders should lean their trading preparation toward an upside breakout.
ADA needs to clear the topside trend line at $1.47, and it should be with compelling underlying volume. Upside targets begin to emerge at the 1.618 Fibonacci extension level of the February-March decline at $2.08, followed by the 2.618 extension level at $3.39 and then the 3.618 extension level at $5.50. The big level is the 1.382 extension level of the 2018-2020 bear market at $7.55.
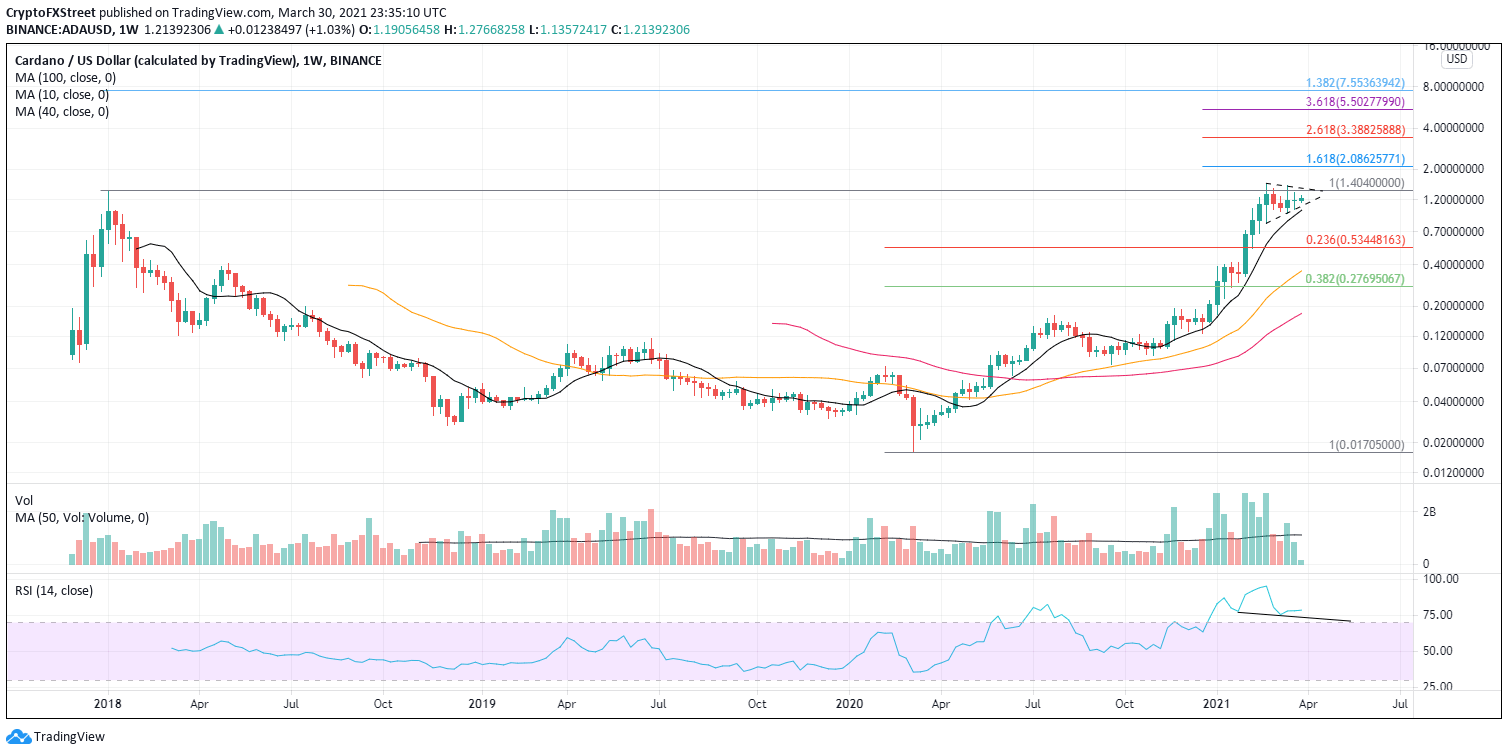
ADA/USD weekly chart
Failures do occur, and traders should turn their sights immediately to the 10-week simple moving average (SMA) at $1.00, a significant psychological level. If that happens, look for the RSI to break the head-and-shoulders top’s neckline, thereby raising the stakes.
This failure could turn ugly below the 10-week SMA as the next support does not materialize until the 0.236 retracement level of the 2020-2021 bull market at $0.53. If the decline continues, and after a few heart palpitations, Cardano price should firm at the 40-week SMA at $0.36, representing a 70% loss from the current price.
Author

Sheldon McIntyre, CMT
Independent Analyst
Sheldon has 24 years of investment experience holding various positions in companies based in the United States and Chile. His core competencies include BRIC and G-10 equity markets, swing and position trading and technical analysis.


