Cardano Price Forecast: Sign of robust bullish reversal emerges despite dwindling DeFi TVL volume
- Cardano rebounds to test resistance at $0.69 as technical indicator flashes a buy signal.
- A minor increase in the derivative Open Interest to $831 million suggests growing trader interest in ADA.
- Cardano's DeFi TVL continues to decline after briefly peaking at around $415 million on May 11.

Cardano's (ADA) price has reversed upwards after testing support at $0.65, trading at $0.69 at the time of writing on Tuesday. The slight rebound occurs amid consolidation in the broader crypto market and tensions in the global macroeconomic environment, primarily caused by uncertainty surrounding United States (US) tariffs.
Cardano upholds a bullish structure
The sell-off in the crypto market last week saw ADA drop to test support at $0.65 before reversing the trend on Monday. Uncertainty surrounding US tariffs, following a court's ruling against President Donald Trump's tariffs, sent shockwaves, triggering a cascade of losses. While an appeals court temporarily suspended the ruling that blocked the implementation of tariffs, uncertainty remains.
Cardano's rebound from $0.65 support confirmed to traders that gains could extend toward the supply-rich region at $1.00. Moreover, a 2.2% increase in the derivatives market Open Interest (OI) to $831 million over the past 24 hours suggests growing interest in ADA, particularly with trading volume remaining above the $1 billion mark.
Futures traders on Binance have a bullish bias, as indicated by a long-to-short ratio of 2.83. At the same time, the liquidation of approximately $198,000 of long positions in the last 24 hours, compared to roughly $394,000 in shorts, signals a potential short squeeze likely to trigger a larger rebound in ADA price.
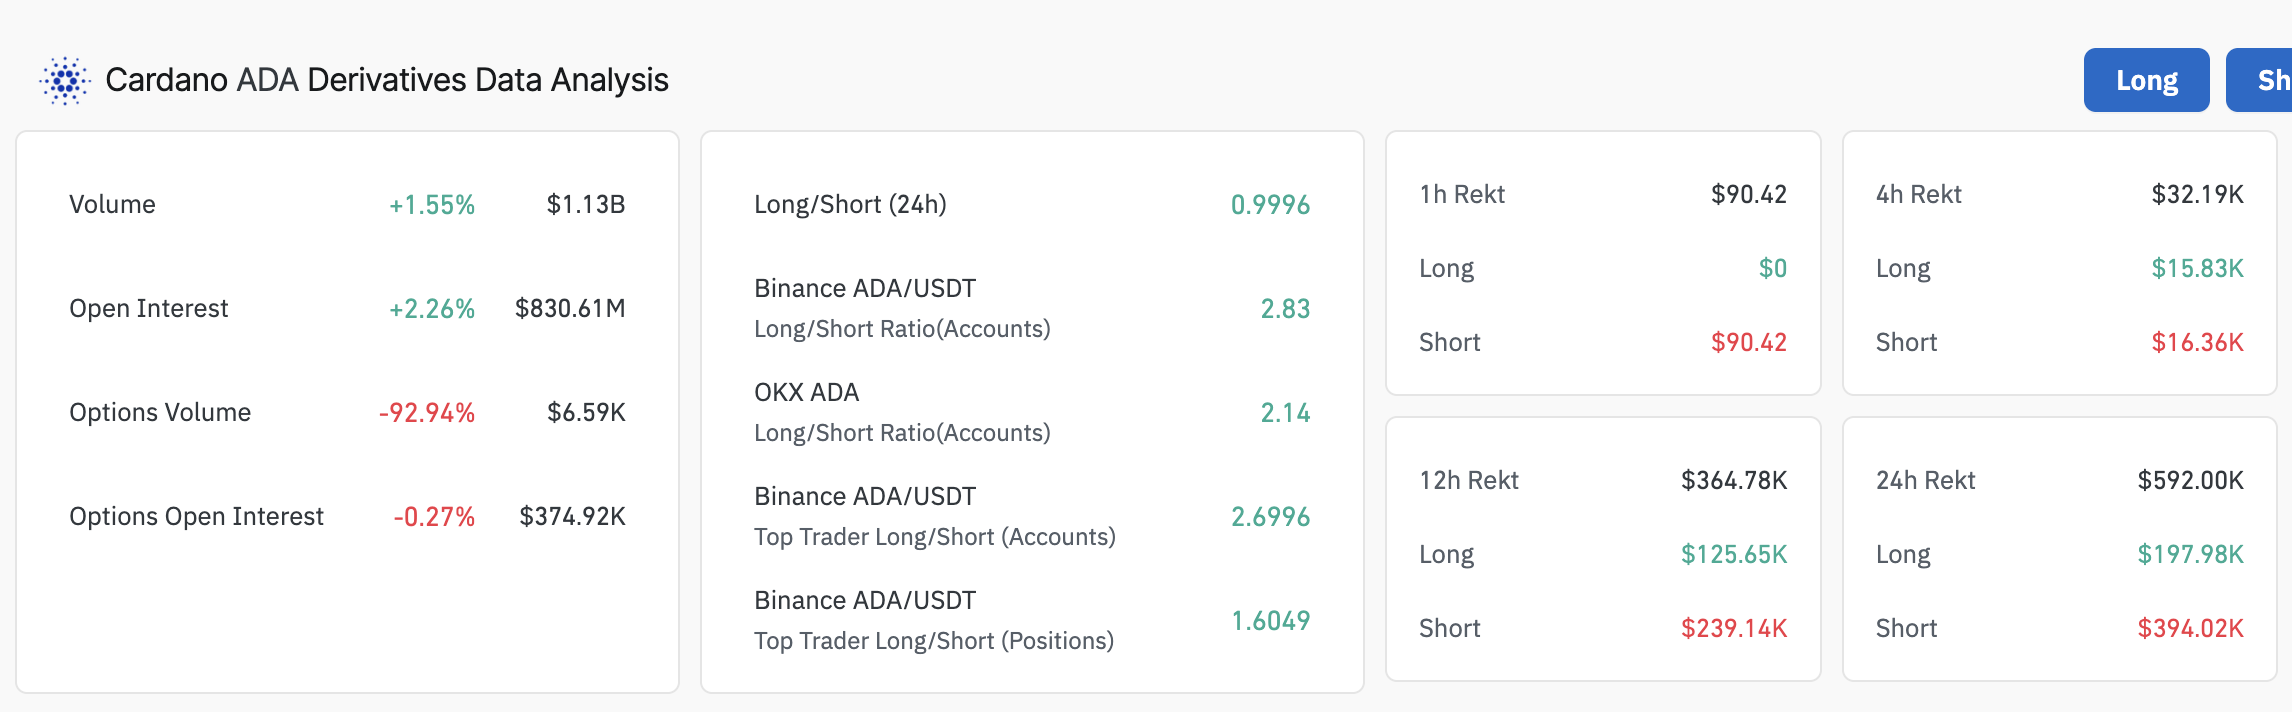
Cardano derivatives data | Source: CoinGlass
Technically, Cardano showcases a bullish structure underpinned by a buy signal from the SuperTrend indicator. This trend-following tool utilizes the Average True Range (ATR) to gauge market volatility. A buy signal is confirmed when the price of ADA flips above the SuperTrend line, with the color of the line changing from red to green. Traders can utilize this indicator as a dynamic support and resistance level, which currently supports Cardano's bullish outlook.
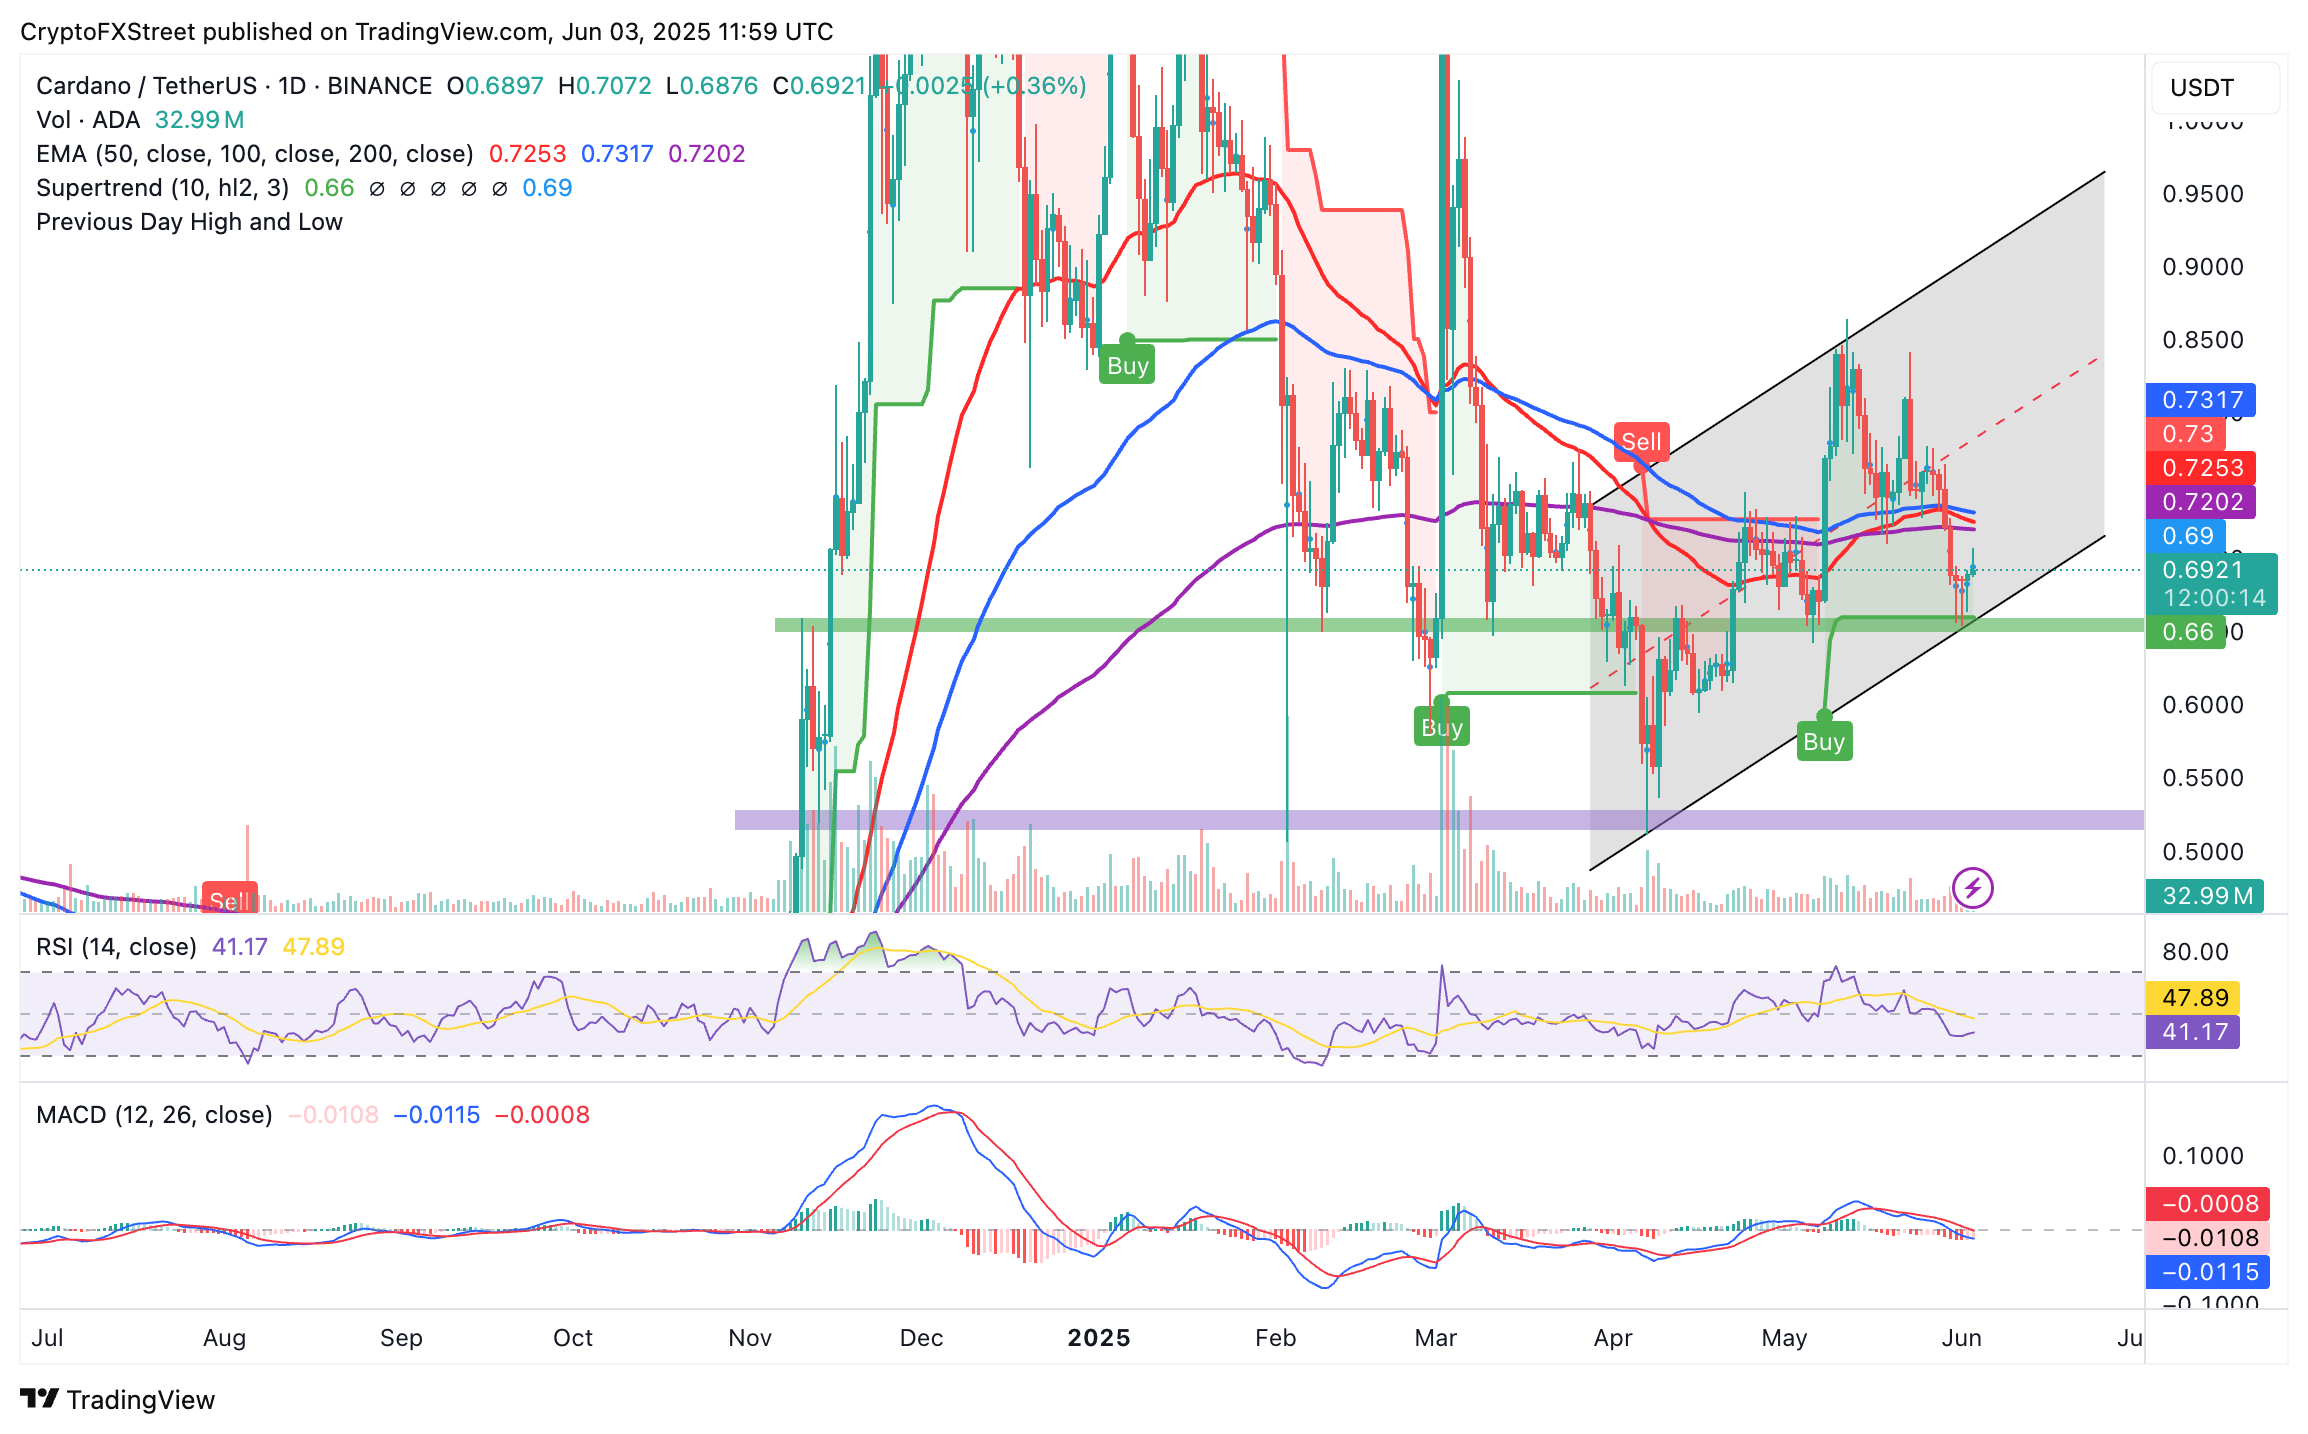
ADA/USD daily chart
The Relative Strength Index (RSI), although below the 50 midline, shows signs of reversing the trend upwards. Should the ADA price break above the immediate hurdle at $0.70, the potential return of the RSI above 50 would mean a stronger bullish momentum.
Cardano's dwindling DeFi TVL could slow its recovery
Despite the bullish outlook, traders should tread carefully, as the Moving Average Convergence Divergence (MACD) indicator reflects bearish sentiment, having sent out a sell signal on May 17. This calls for traders to consider selling ADA manifests when the blue MACD line crosses beneath the red signal line.
At the same time, the persistent drop in Cardano's Decentralized Finance (DeFi) Total Value Locked (TVL) to approximately $317 million, after peaking briefly at around $414 million on May 11, shows that investor confidence in the ecosystem is falling.
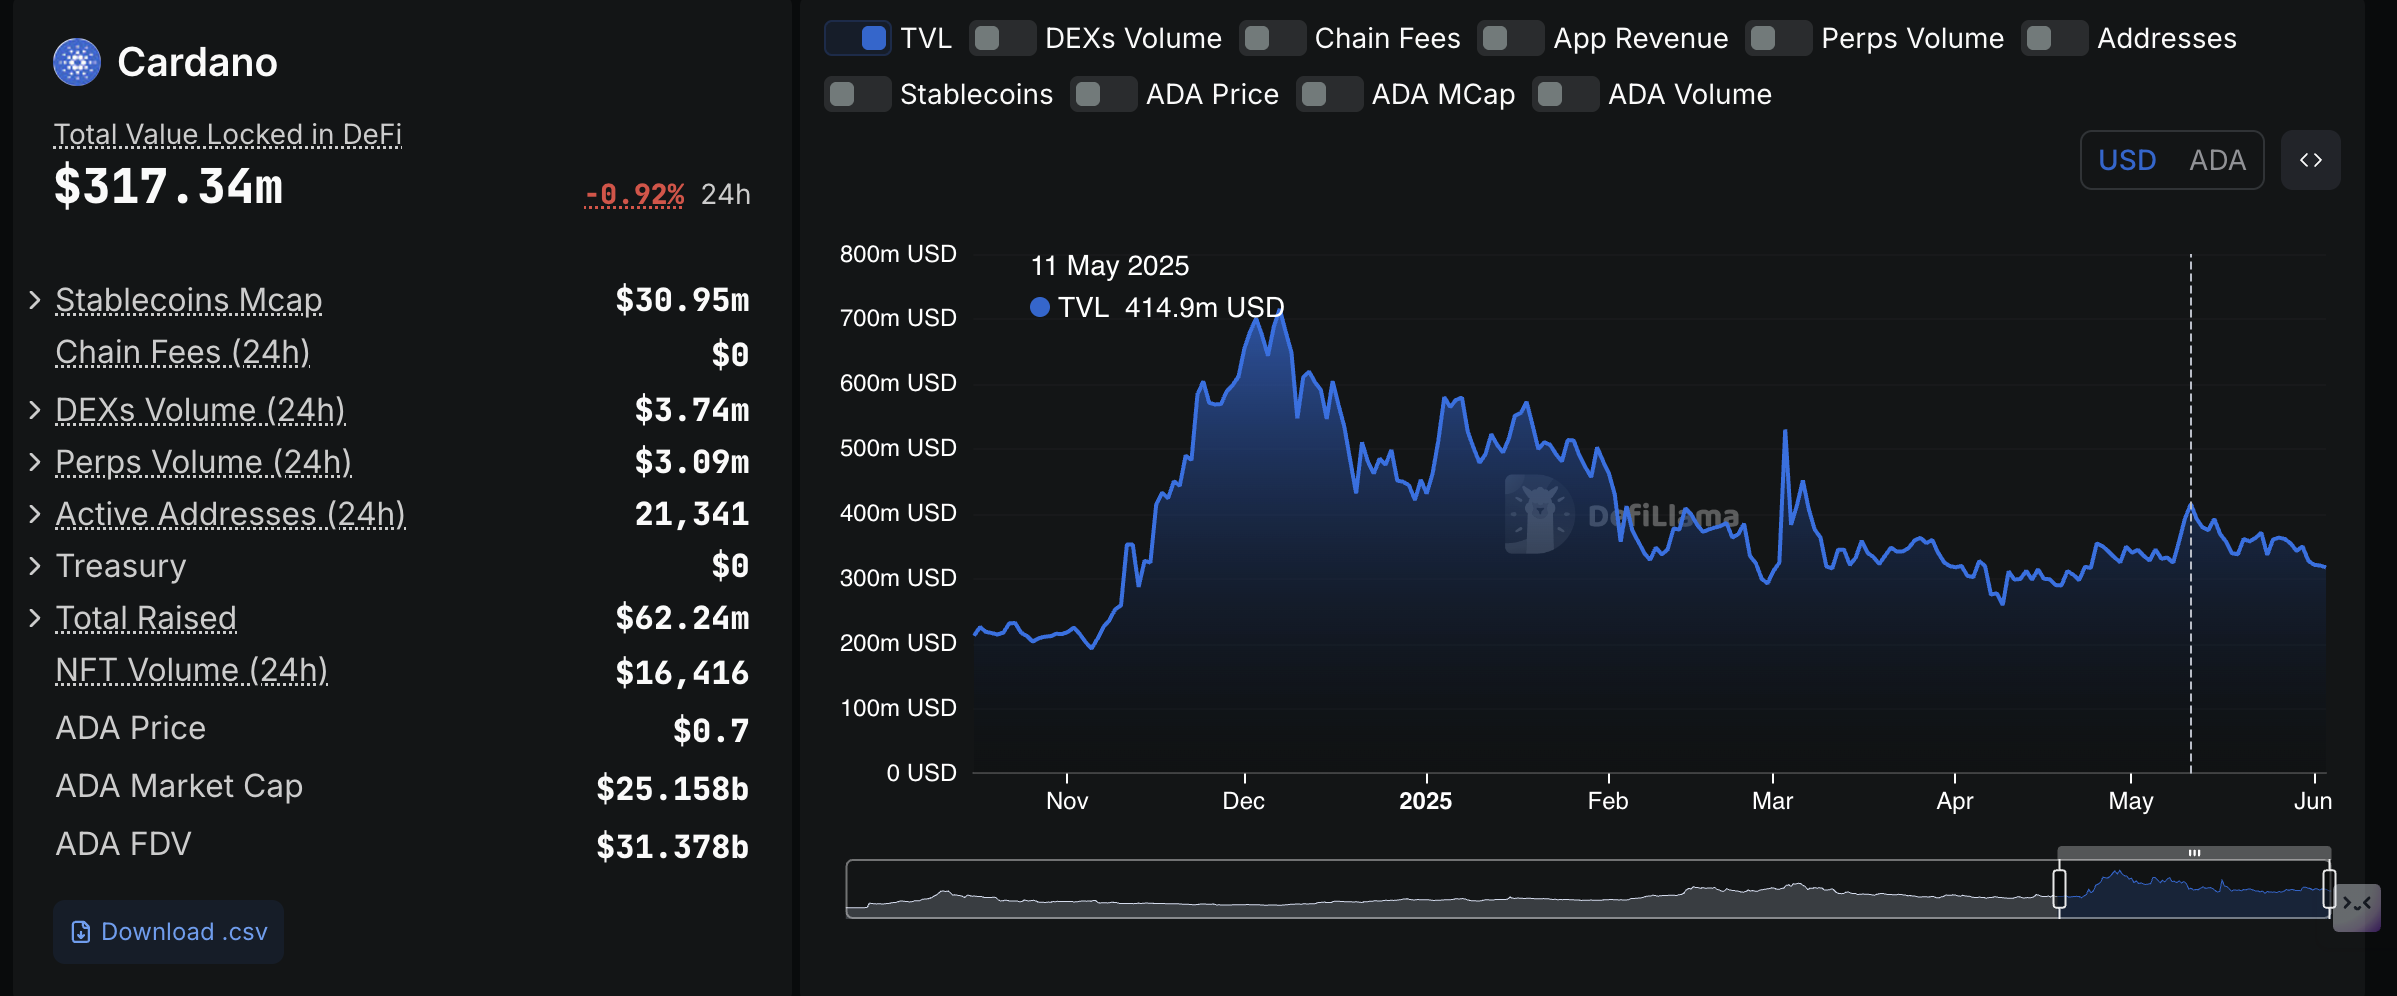
Cardano DeFi TVL | Source: DefiLlama
Investors often withdraw their digital assets from smart contracts with the intention of selling. A lower TVL suggests a decline in the adoption of the protocol within the DeFi ecosystem, which translates to low demand for ADA used to pay transaction fees, stake, and participate in governance.
Cryptocurrency metrics FAQs
The developer or creator of each cryptocurrency decides on the total number of tokens that can be minted or issued. Only a certain number of these assets can be minted by mining, staking or other mechanisms. This is defined by the algorithm of the underlying blockchain technology. On the other hand, circulating supply can also be decreased via actions such as burning tokens, or mistakenly sending assets to addresses of other incompatible blockchains.
Market capitalization is the result of multiplying the circulating supply of a certain asset by the asset’s current market value.
Trading volume refers to the total number of tokens for a specific asset that has been transacted or exchanged between buyers and sellers within set trading hours, for example, 24 hours. It is used to gauge market sentiment, this metric combines all volumes on centralized exchanges and decentralized exchanges. Increasing trading volume often denotes the demand for a certain asset as more people are buying and selling the cryptocurrency.
Funding rates are a concept designed to encourage traders to take positions and ensure perpetual contract prices match spot markets. It defines a mechanism by exchanges to ensure that future prices and index prices periodic payments regularly converge. When the funding rate is positive, the price of the perpetual contract is higher than the mark price. This means traders who are bullish and have opened long positions pay traders who are in short positions. On the other hand, a negative funding rate means perpetual prices are below the mark price, and hence traders with short positions pay traders who have opened long positions.
Author

John Isige
FXStreet
John Isige is a seasoned cryptocurrency journalist and markets analyst committed to delivering high-quality, actionable insights tailored to traders, investors, and crypto enthusiasts. He enjoys deep dives into emerging Web3 tren


