Cardano Price Forecast: ADA targets $3.60, as the chase begins
- Cardano price triggers a base-on-base pattern with yesterday’s rally above the May high of $2.51.
- ADA breakout spotlights 261.8% Fibonacci extension of the 2018-2020 secular correction at $3.63.
- Volume profile has yet to mimic the high levels of commitment and emotion present during the rise off the 2020 lows to the 2021 high.

Cardano price climb to new highs has been impulsive after reclaiming the influential resistance of the 2018 high at $1.40, carrying ADA to five consecutive positive weeks for the first time since March-April 2020 (also a low). The rally’s strength has lifted the daily Relative Strength Index (RSI) to one of the highest readings, suggesting that a minor consolidation around the May high of $2.51 may emerge before the digital coin resumes the secular advance.
Cardano price pattern directs a bullish forecast
Cardano price corrected over 60% from the May high, falling below the 2018 high of $1.40. The price structure since the correction has formed a new base on top of the previous three-year base that extends from 2018 to 2021.
The rare price structure is a bullish development and raises the probability that Cardano price will target much higher prices in the months ahead, including the 261.8% Fibonacci extension at $3.63.
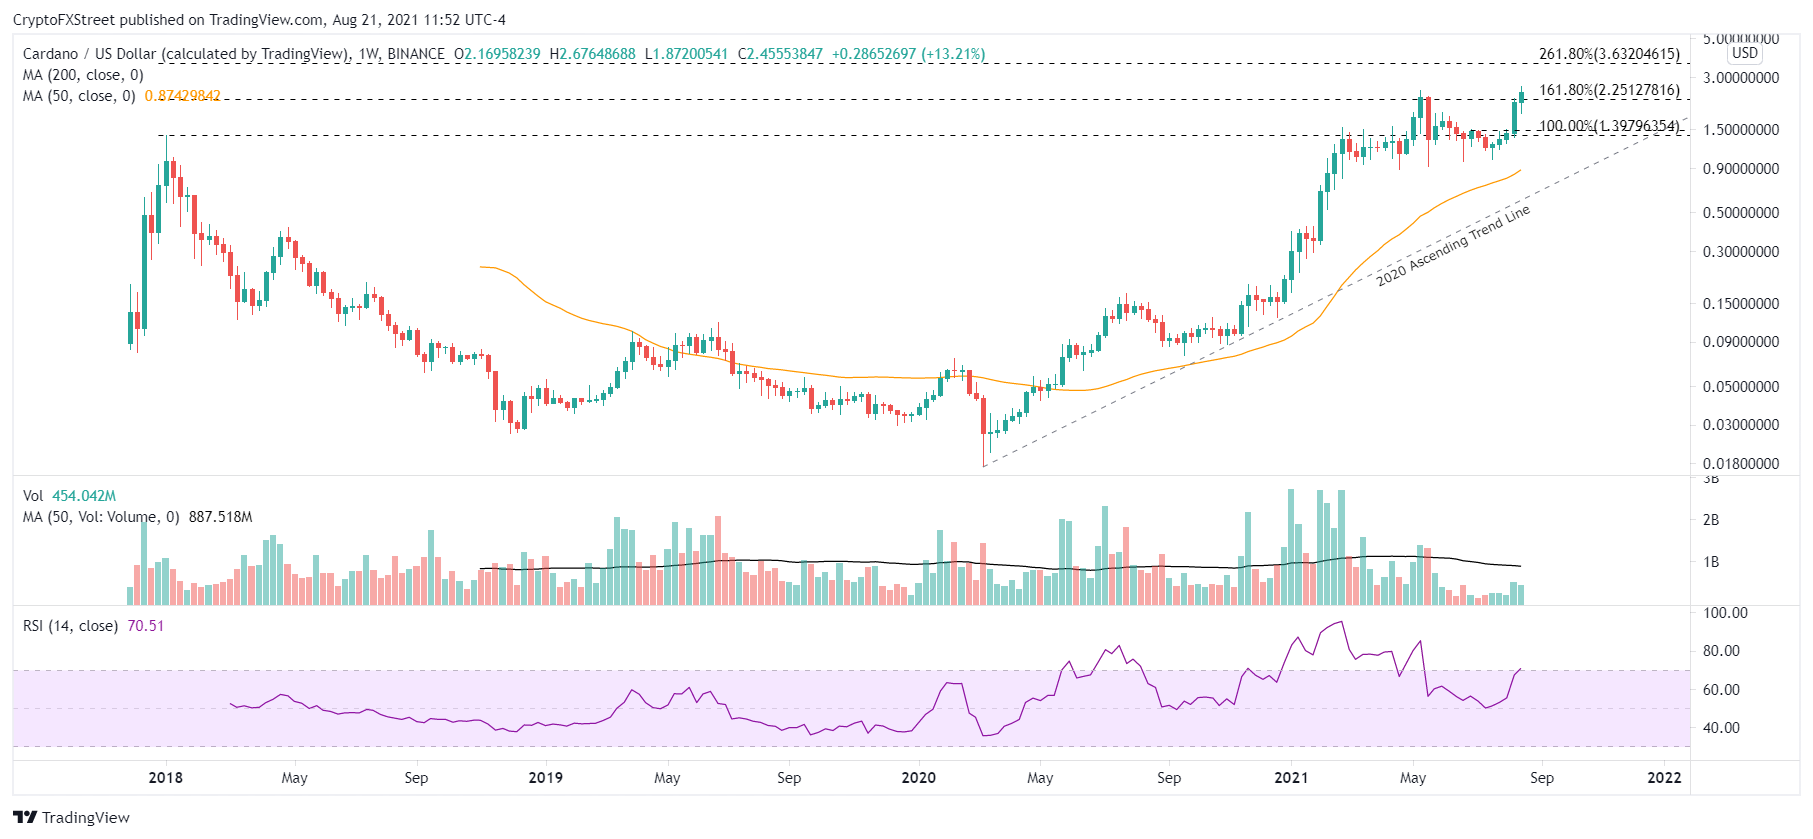
ADA/USD weekly chart
From a daily perspective, the doji candlestick pattern yesterday does reveal some reluctance to attack new Cardano price highs with authority as ADA investors captured profits or liquidated positions after breaking even on positions entered in May.
Moreover, the ADA daily RSI is still showing a noteworthy overbought condition that was tempered by the three-day pullback earlier this week. Thus, it is conceivable that Cardano price does experience a second pullback for the rally, only to reset the indicators and ADA price structure to achieve a sustainable rally to the critical Fibonacci extension levels.
Nevertheless, the Cardano outlook is bullish, with the next resistance beginning with the 141.4% extension of the May-July correction at $3.17, followed by the 161.8% extension of the same correction at $3.49. If ADA rallies with the same impulsiveness over the last five weeks, it should tag the 261.8% extension of the 2018-2020 secular correction at $3.63, representing a 48% return from the current price.
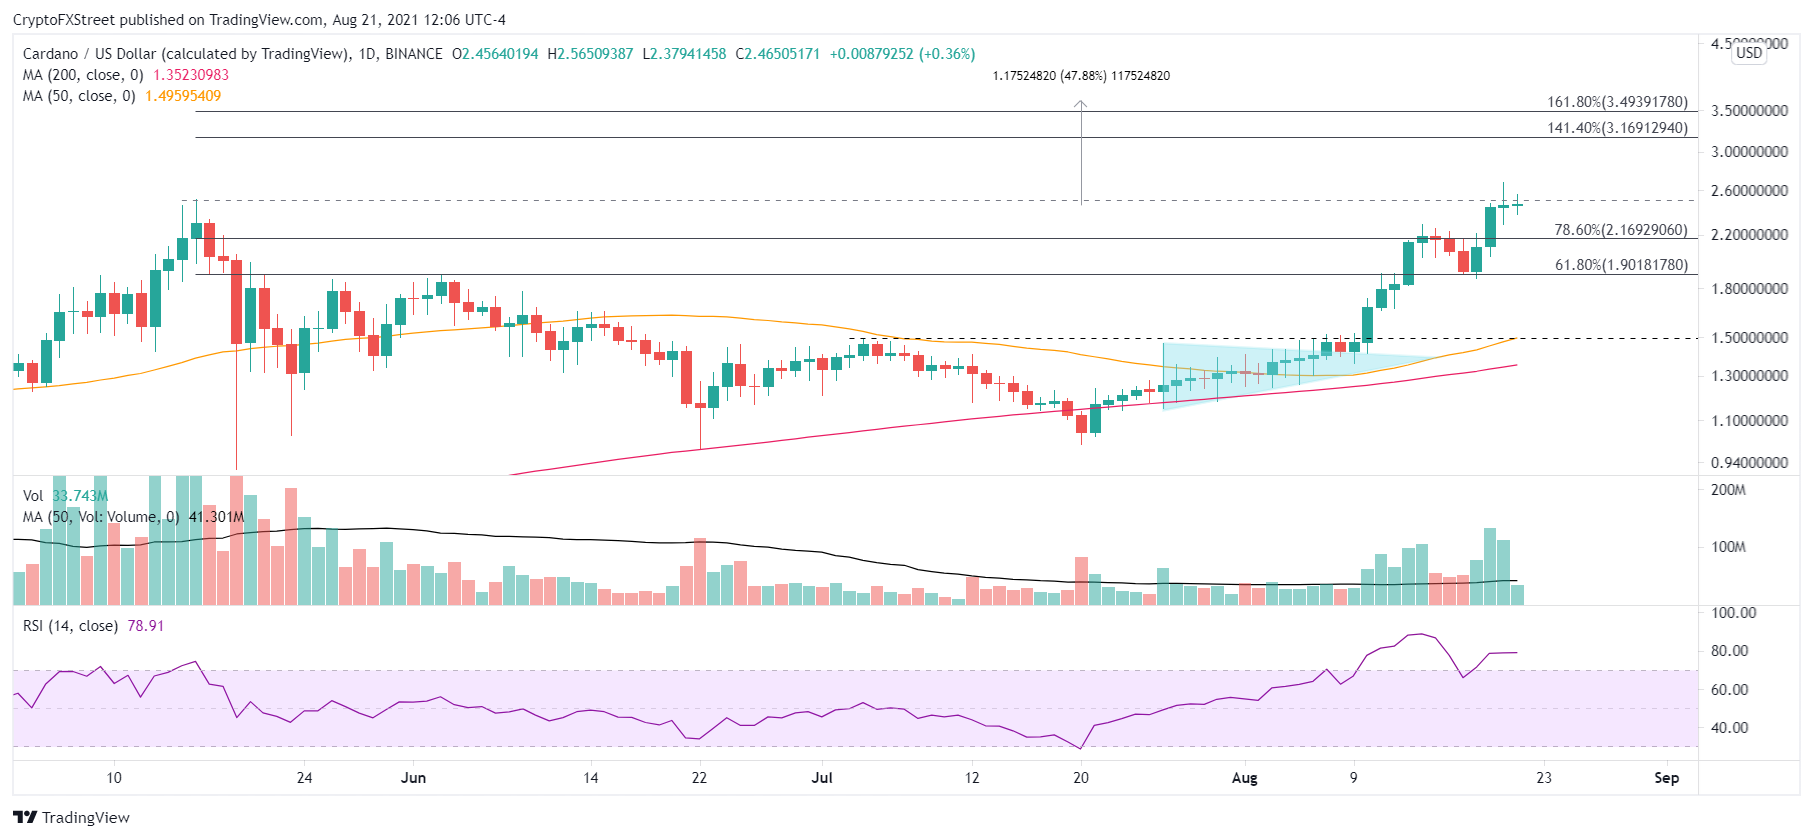
ADA/USD daily chart
Suppose Cardano price fails to hold $2.16 during a pullback. In that case, ADA could retrace back to $1.90 again before commencing the next leg higher. Only a day closing below $1.90 would undermine the bullish narrative.
Cardano price finally solved the 2018 high riddle and is on pace to close with five consecutive positive weeks for the first since the last significant low in March-April 2020. The velocity and magnitude of the recovery to the May high show a renewed investor interest in ADA. Still, the weekly volume totals have not reached the levels that underpinned the 2020-2021 advance, indicating the chase has not begun.
Here, FXStreet's analysts evaluate where ADA could be heading next as it seems primed for new all-time highs.
Author

Sheldon McIntyre, CMT
Independent Analyst
Sheldon has 24 years of investment experience holding various positions in companies based in the United States and Chile. His core competencies include BRIC and G-10 equity markets, swing and position trading and technical analysis.


