Cardano Price Forecast: ADA set for further decline on profit-taking acceleration, selling pressure
- Cardano price breaks below the ascending trendline, signaling a bearish move ahead.
- On-chain data indicate that ADA holders are realizing profits, which is fueling the selling pressure.
- The technical outlook suggests a potential correction ahead, with a downside target near the $0.70 level.

Cardano (ADA) is trading in the red at around $0.80 as of Thursday’s writing, following a close below the ascending trendline earlier this week. On-chain data paints a bearish picture as holders realize profits and increase selling pressure. Furthermore, the technical outlook suggests a potential correction is on the horizon, with bears targeting the $0.70 mark.
Cardano faces pressure as profit-taking rises and bearish bets increase among traders
Santiments’ Network Realized Profit/Loss (NPL) metric shows Cardano holders are booking some profits after a massive drop in ADA price this week. This metric computes a daily network-level Return On Investment (ROI) based on the coin’s on-chain transaction volume. Strong spikes in a coin’s NPL indicate that its holders are, on average, selling their bags at a significant profit. On the other hand, strong dips imply that the coin’s holders are, on average, realizing losses, suggesting panic sell-offs and investor capitulation.
As shown in the chart below, the metric showed a strong spike on Tuesday and Wednesday, indicating that holders are, on average, selling their bags at a significant profit and increasing the selling pressure.
 [08-1758770497886-1758770497888.33.57, 25 Sep, 2025].png)
ADA NPL chart. Source: Santiment
Apart from increasing selling pressure, Coinglass data show that the long-to-short ratio for Cardano reads 0.84 on Thursday. This ratio, below one, reflects bearish sentiment in the markets, as more traders are betting on the Cardano price to fall.
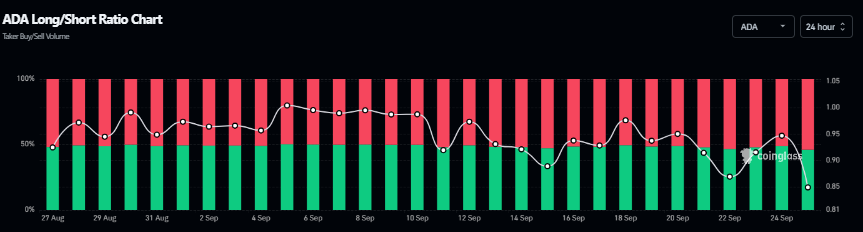
Cardano long-to-short ratio chart. Source: Coinglass
Additionally, as explained in the previous report, the rising activity among the dormant wallets further supports the bearish sentiment.
Cardano Price Forecast: ADA bears aiming for further correction
Cardano price broke below the ascending trendline (drawn by connecting multiple lows since early July) on Monday and declined 8.83% by the next day. However, on Wednesday, it recovered slightly, facing resistance around the 61.8% Fibonacci retracement level at $0.82 (drawn from the June low of $0.51 to the August high of $1.02). At the time of writing on Thursday, it trades around $0.80.
If ADA continues its downward trend and closes below the 100-day EMA at $0.80 on a daily basis, it could extend the decline to retest its 50% price retracement level at $0.76. A successful close below this level could extend the losses toward the daily level at $0.70.
The Relative Strength Index (RSI) on the daily chart reads 40, below its neutral level of 50, indicating bearish momentum. Additionally, the Moving Average Convergence Divergence (MACD) also showed a bearish crossover on Monday, signaling a sell and indicating bearish momentum and a downward trend ahead.
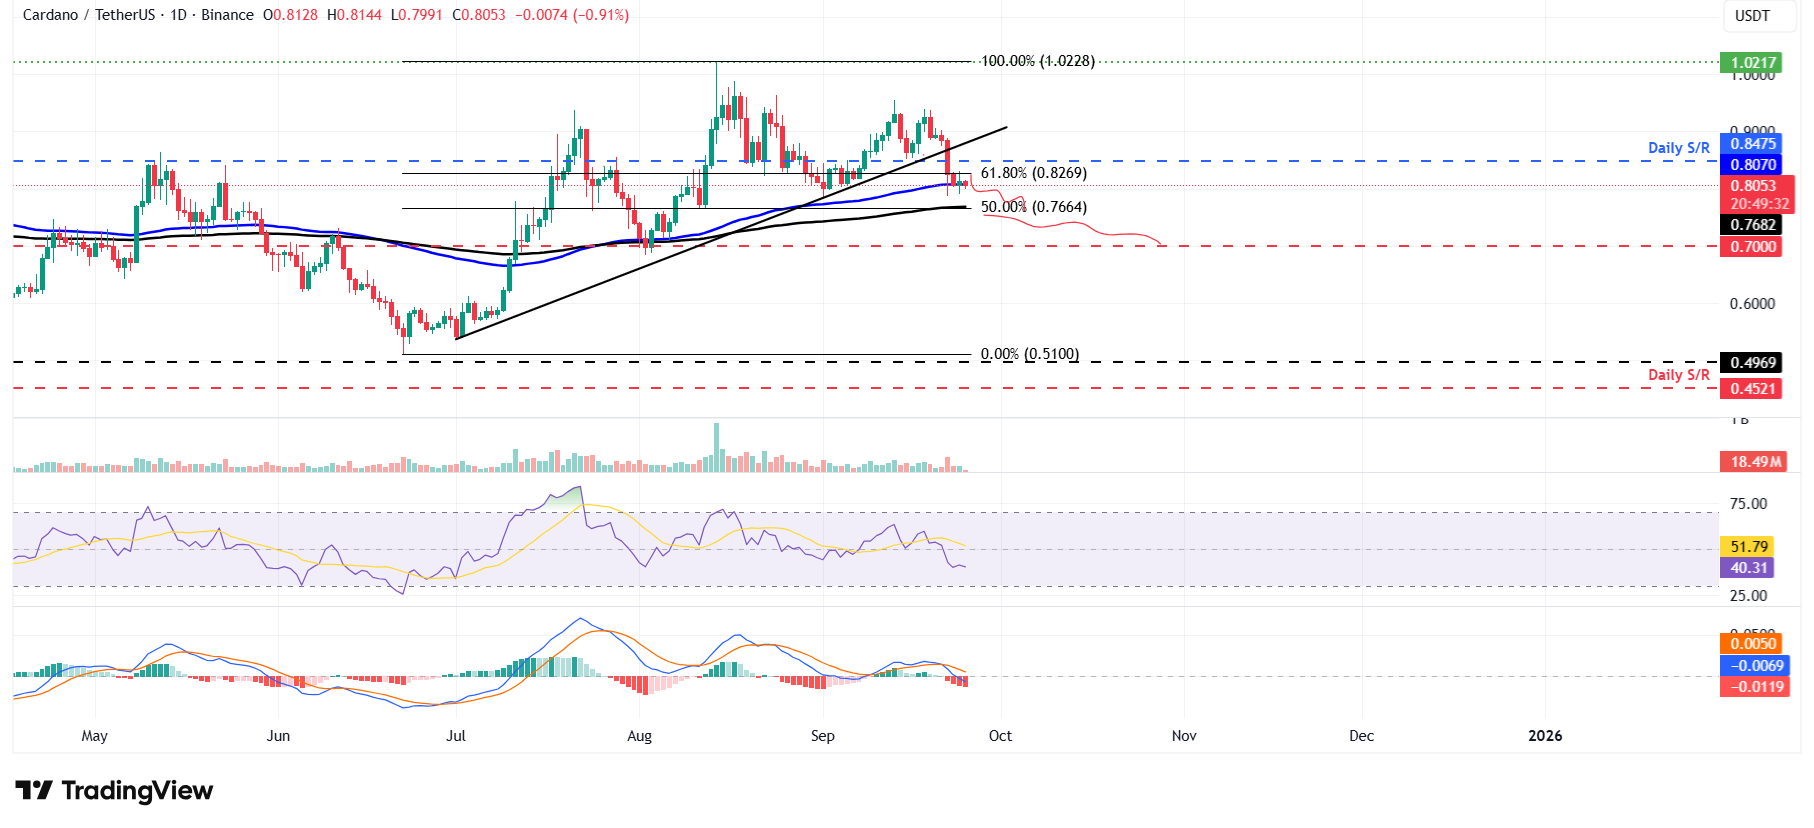
ADA/USDT daily chart
However, if ADA recovers, it could extend the recovery toward the daily resistance level at $0.84.
Author

Manish Chhetri
FXStreet
Manish Chhetri is a crypto specialist with over four years of experience in the cryptocurrency industry.



