Cardano Price Analysis: ADA struggles to reach new all-time highs as overhead pressure intensifies
- Cardano hunts for support after rejection from highs slightly below $1.
- On-chain analysis reveals that recovery will not be a walk in the park.
- ADA will have to reclaim the 50 SMA support on the 4-hour chart to renew the uptrend.

Cardano has recently traded a new yearly high of $0.99, cutting short the rally toward all-time highs. Selling pressure continued to rise due to the failed breakout at $1. ADA also lost several tentative support areas, including $0.9 and $0.8. Meanwhile, losses are likely to continue amid rising overhead pressure.
Cardano’s reverse gears engaged
The 4-hour chart illustrates a worsening technical picture for the aspiring smart contract token. For instance, the 50 Simple Moving Average support has been lost, adding credibility to the bearish outlook. On the downside, the nearest substantial support lies at the 100 SMA near $0.4.
Similarly, the Moving Average Convergence Divergence (MACD) on the same 4-hour chart is also sending bearish signals. The MACD is a trend indicator that doubles up as a momentum measuring tool. Declines became apparent after the MACD line (blue) crossed below the signal line. As long this technical picture remains the same, Cardano will struggle with recovery while sellers become stronger.
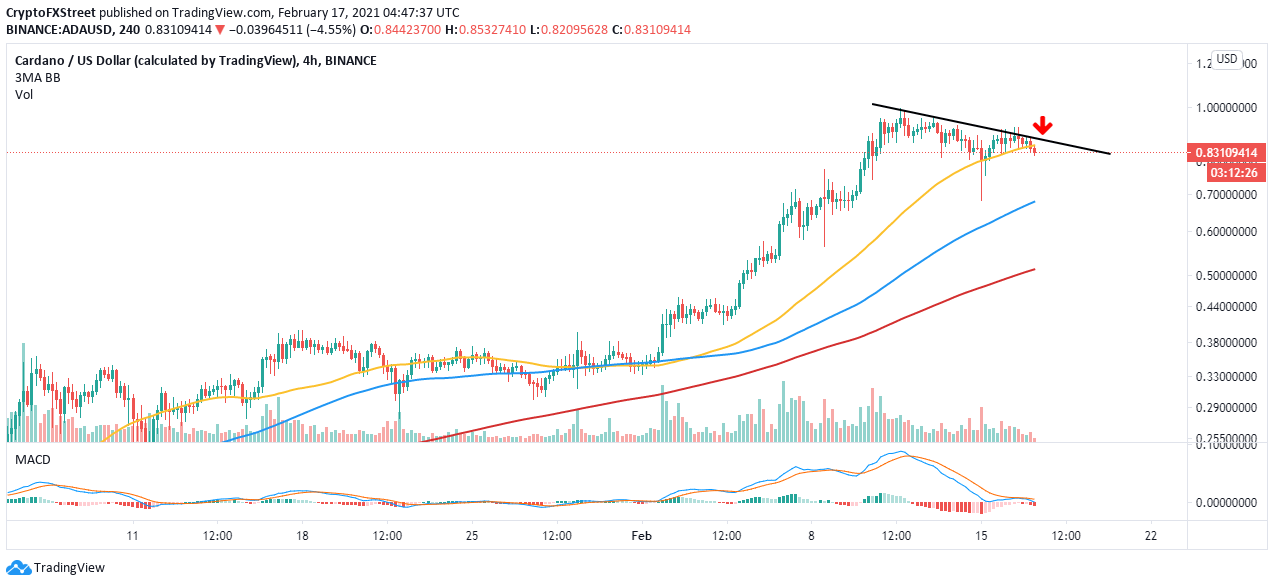
ADA/USD 4-hour chart
The IOMAP model by IntoTheBlock shows that resistance is intense ahead of Cardano. It is doubtful that the buyers will slice through the most robust resistance zone running from $0.86 to $0.88. Here, nearly 66,600 addresses had bought roughly 4.2 billion ADA.
On the flip side, smaller support areas have manifested to anchor Cardano. This means that if overhead pressure increases, the freefall might be unstoppable. However, the IOMAP brings our attention to the region running from$0.79 to $0.81. Here, about 28,000 addresses are profiting from the approximately 883 million ADA bought in this zone.
-637491356970778045.png)
Cardano IOMAP model
Looking at the other side of the fence
If ADA recovers and closes the day above the 50 SMA on the 4-hour chart, the pessimistic outlook will be thrown out the window. Moreover, trading above the trendline resistance observed on the chart will encourage more buyers to join the market as they anticipate the ultimate liftoff above $1.
Author

John Isige
FXStreet
John Isige is a seasoned cryptocurrency journalist and markets analyst committed to delivering high-quality, actionable insights tailored to traders, investors, and crypto enthusiasts. He enjoys deep dives into emerging Web3 tren


