Cardano Elliott Wave technical analysis [Video]
![Cardano Elliott Wave technical analysis [Video]](https://editorial.fxstreet.com/images/Markets/Currencies/Cryptocurrencies/Coins/Cardano/cardano.jpg)
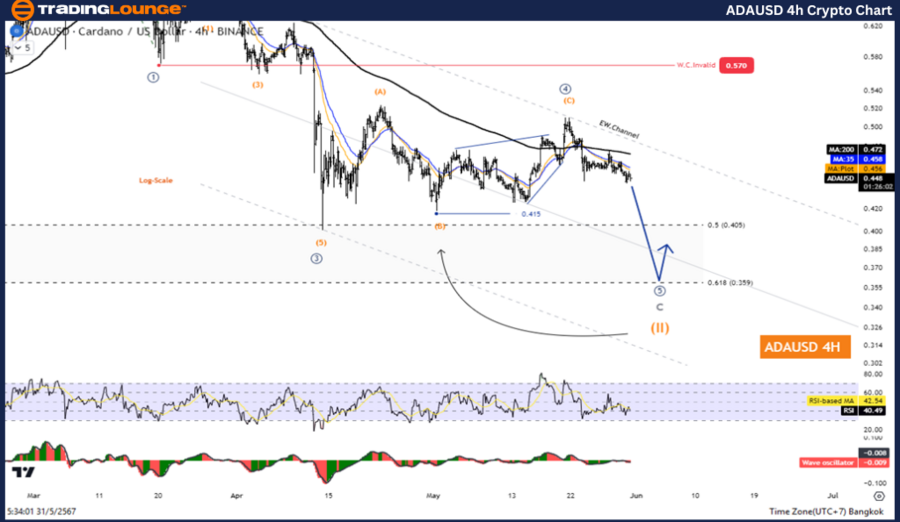
ADA/USD Elliott Wave technical analysis
Function: Counter trend.
Mode: Corrective.
Structure: Flat.
Position: Wave C.
Direction next higher degrees: Wave (II) of impulse.
Details: Wave II is equal to 61.8% of wave I at 0.358.
ADA/USD trading strategy
The correction in wave (II) is likely to test the 61.8% level (0.359) before rising again in wave (III), waiting for the correction to complete to rejoin the trend further uptrend.
ADA/USD technical indicators
The price is below the MA200 indicating a downtrend, the wave oscillator is a bearish momentum.
.thumb-638527257023811730.png.3d884bd0d3126672febd80bc5b1cb7ac-638527257023811730.png)
ADA/USD Elliott Wave technical analysis
Function: Follow trend.
Mode: Motive.
Structure: Impulse.
Position: Wave 4.
Direction next higher degrees: Wave C of flat.
Details: A short-term pullback in wave 4 before falling again in wave 5.
ADA/USD trading strategy
The correction in wave (II) is likely to test the 61.8% level (0.359) before rising again in wave (III), waiting for the correction to complete to rejoin the trend further uptrend.
ADA/USD technical indicators
The price is below the MA200 indicating a downtrend, the wave oscillator is a bearish momentum.
ADA/USD Elliott Wave technical analysis [Video]
Author

Peter Mathers
TradingLounge
Peter Mathers started actively trading in 1982. He began his career at Hoei and Shoin, a Japanese futures trading company.


