Cardano begins seventh consecutive month of losses, ADA weekly close lowest since February 2021
- Cardano price action is bearish despite record-breaking accumulation by whales.
- ADA daily close is the lowest of the past 390-days.
- Flash crash to $0.35 increasingly likely as buyers seemingly abandon Cardano.

Cardano price action last Monday hinted at a possible recovery and broader trend change after six consecutive months of losses. However, sellers remained in control and not only wiped out all of Cardano’s Monday gains but pushed Cardano to a new lowest close of the past 390-days.
Cardano price preps for a capitulation move of 60% to the $0.35, returning to January 2021 price levels
Cardano price is currently below all supportive Ichimoku levels and displays extensive weakness and continued bearish price action. The most crucial support level for ADA is the $0.80 value area. It represents the final high volume node in the 2021 and 2022 Volume Profiles before Cardano could trigger a flash-crash to the next high volume node at $0.35. The Volume Profile is almost empty between $0.35 and $0.80, giving bears an amazing short opportunity ahead.
However, despite the bearish conditions and apparent abandonment by bulls, Cardano price is at one of the most bullish moments in over a year from a time perspective.
One of the Fathers of Technical Analysis, W.D. Gann’s methods confuse and confound contemporary analysts, investors, and traders. The most critical factor in Gann Analysis is the focus of time. Time, Gann wrote, is the reason why markets move and trends change. The time factor affecting Cardano is one of Gann’s cycles.
Cardano is inside one of the most powerful divisions of the Cycle of the Inner Year – the 180-day cycle. Gann wrote that any instrument trending strongly for 180-days faces a very high probability of a trend reversal or strong corrective move. Consequently, March 1, 2022, is the 180th day from the all-time high of $3.09 found on September 2, 2021. Additionally, March 1, 2022, is the beginning of a New Moon lunar phase – another important time event in Gann Analysis.
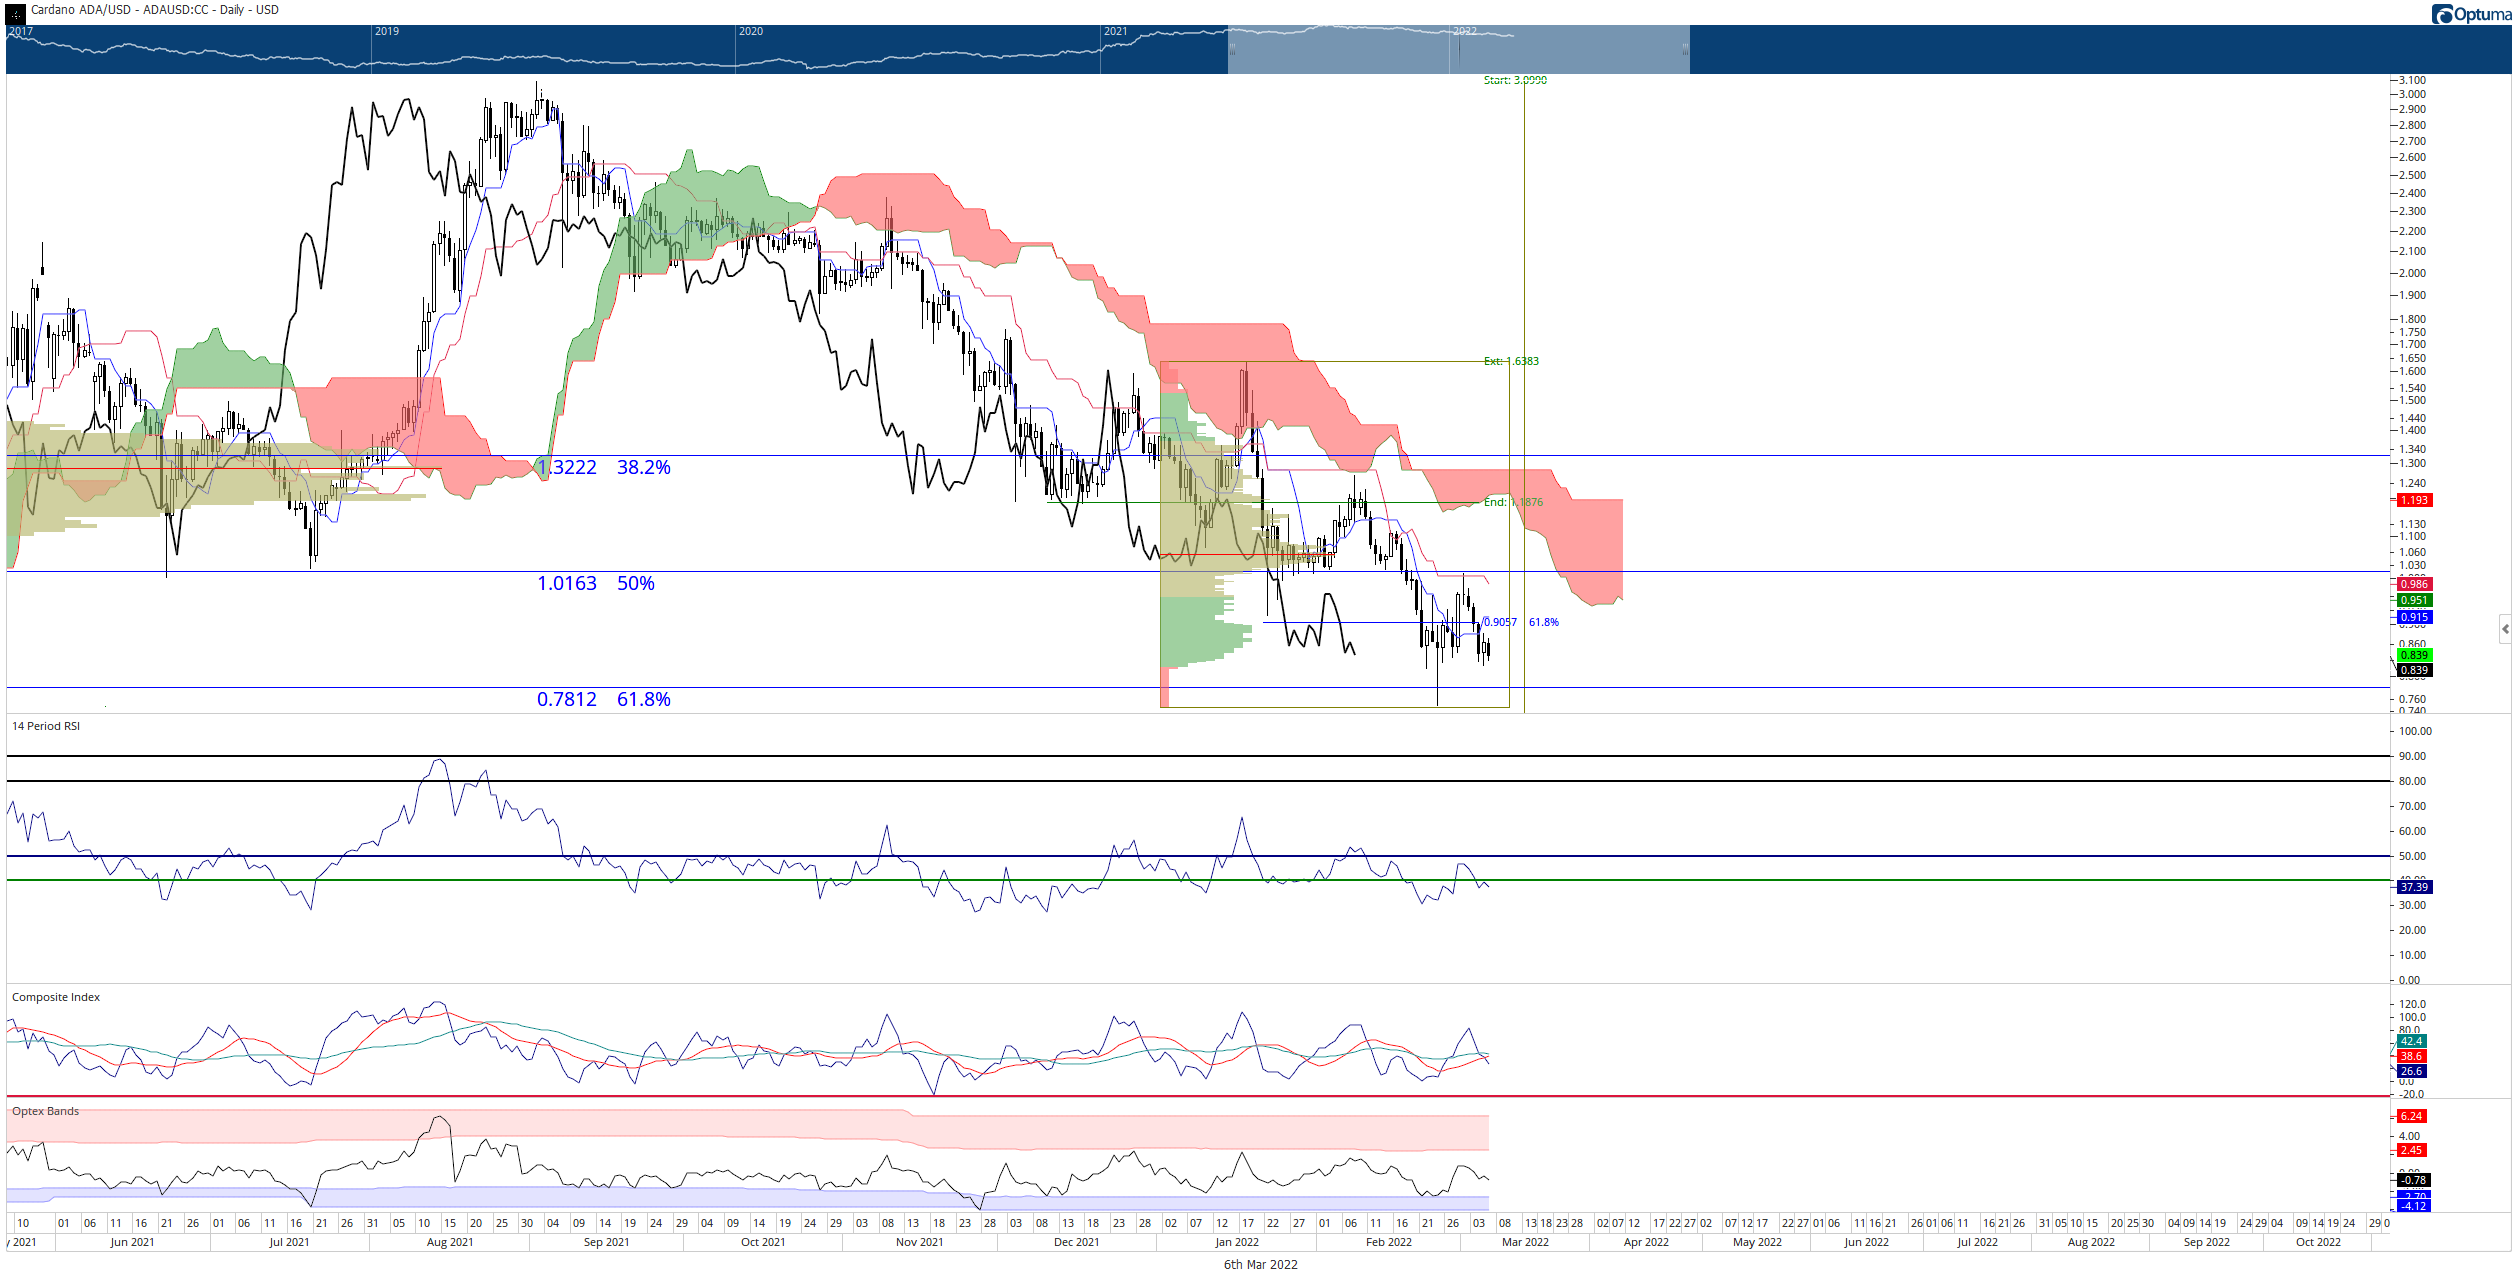
ADA/USD Daily Ichimoku Kinko Hyo Chart
It can take up to fifteen days after the cyclical event for an instrument’s price action to respond. That means Cardano price could experience lower prices but still initiate a broader reversal anytime between March 1 and March 15
Combined with the extreme oversold nature of Cardano price, the new all-time low on the monthly Composite Index, and the massive gaps between the bodies of the candlesticks and the Tenkan-Sen, Cardano is poised for an explosive move higher. Therefore, the first target that bulls will test as resistance is the critical psychological $1 level. The 50% Fibonacci retracement and daily Kijun-Sen share the $1.
Ultimately, if bulls want to convert Cardano into a clear new uptrend, then Cardano price needs to complete an Ideal Bullish Ichimoku Breakout. That means Cardano needs to close at or above the $1.30 value area.
Author

Jonathan Morgan
Independent Analyst
Jonathan has been working as an Independent future, forex, and cryptocurrency trader and analyst for 8 years. He also has been writing for the past 5 years.




