Why the Polkadot price is a gambler’s vice
- DOT price trades at the upper bounds of a tight spread range.
- Polkadot price consolidated still below a parallel channel.
- Invalidation of the neutral thesis is a breach above $11.34.

Polkadot has a double scenario-like price action that needs further investigation before forecasting a profitable trade.Traders should consider looking for more profitable opportunities.
Polkadot price could go either way
Polkadot price is portraying itself as a questionable digital asset within the crypto ecosystem. The DOT price has had several liquidity hunts on both sides of the playing field throughout the month of May. The unpredictable price action displayed from DOT price could be Market Makers' validating the idea for a $10-10.50 zone to continue out for a few weeks. If market conditions continue, the Maker Maker's strategy to induce traders to take a long position for minimal returns could occur.
Polkadot price provides further confluence of the tight range to continue as the current $10.33 still resides below a parallel consolidation channel. Buying now could be a high-risk entry since the trend channel has not been breached. Shorting the digital asset before the breach could also be a trade setup doomed for failure as Market Makers could continue to trap liquidity.
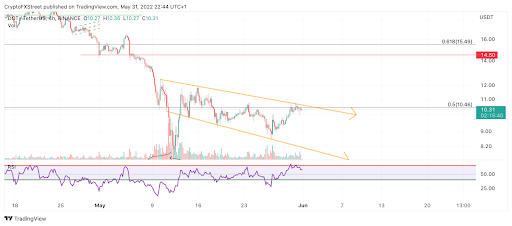
DOT/USDT 4-Hour Chart
The invalidation of the neutral bias will be a breach of $11.34. If this event occurs, analysts can deem the current downtrend as over for now. The DOT price could potentially rally back $15, resulting in a 50% increase from the current Polkadot price.
Author
FXStreet Team
FXStreet
Composed of a group of economic journalists and FX experts, the FXStreet content team produces and oversees all content published on FXStreet. It provides a purely journalistic approach to the Forex market.


