BTCUSD: Elliott Wave and Technical Analysis Charts

The first preferred Elliott wave count expected Bitcoin to exhibit an increase in downwards momentum. This is exactly what is happening. The second Elliott wave count was invalidated seven days ago.
Summary: Downwards movement has push from rising volume. This is very bearish. Expect downwards movement to continue until there is a bullish candlestick reversal signal on the daily chart. Next support below is at 3,612 and 2,980.
I cannot at this time yet see a completed corrective Elliott wave structure for this downwards movement, so I expect it is incomplete.
The data used for this analysis now comes from Yahoo Finance BTC-USD.
Updates to this analysis are in bold.
FIRST ELLIOTT WAVE COUNT
MONTHLY
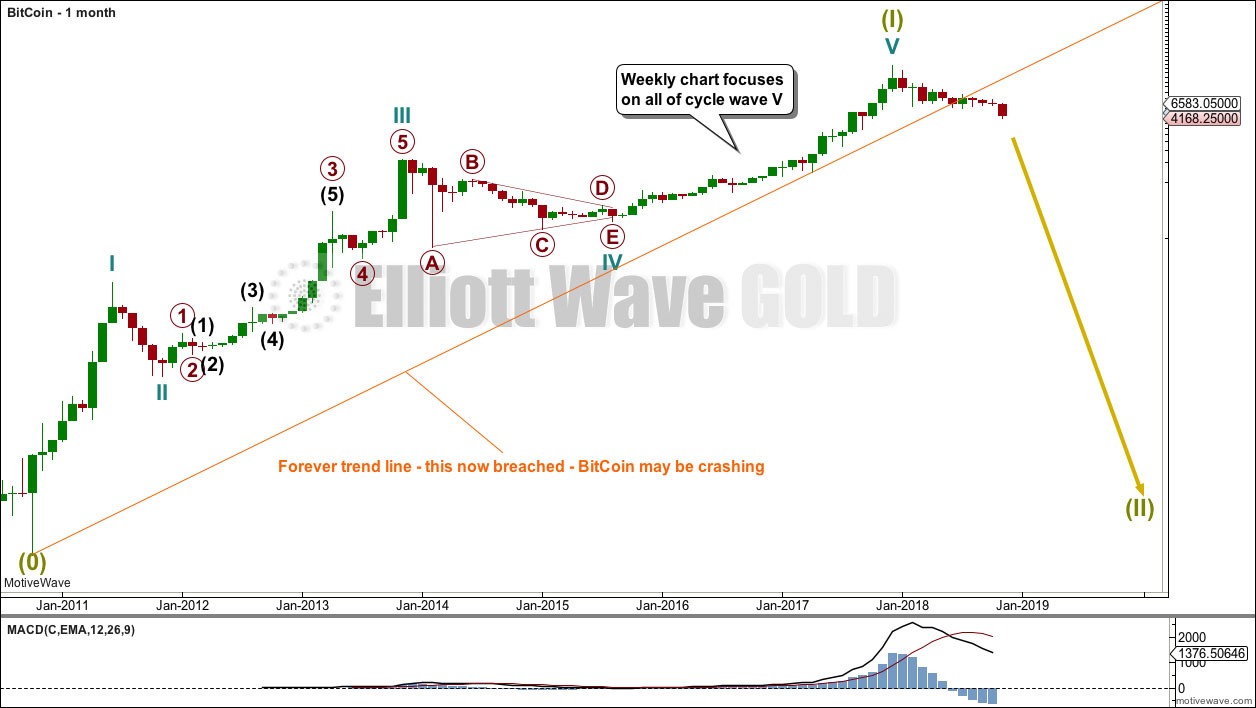
It is possible to see a completed five wave impulse upwards for Bitcoin.
I am unable to find reasonable Fibonacci ratios within this wave count. It appears that Bitcoin may not exhibit Fibonacci ratios very often between its waves, so this makes target calculation impossible. Classic technical analysis was used to identify a high in place on the 23rd of December, 2017.
22/11/18, 12:13 PM What is very clear from this chart is that Bitcoin is a classic bubble. This looks like an even larger bubble than the Tulip Mania. The only thing about which I am certain is that this bubble will pop and Bitcoin will collapse.
Now that the Forever trend line is breached some confidence may be had that Bitcoin may be crashing.
WEEKLY
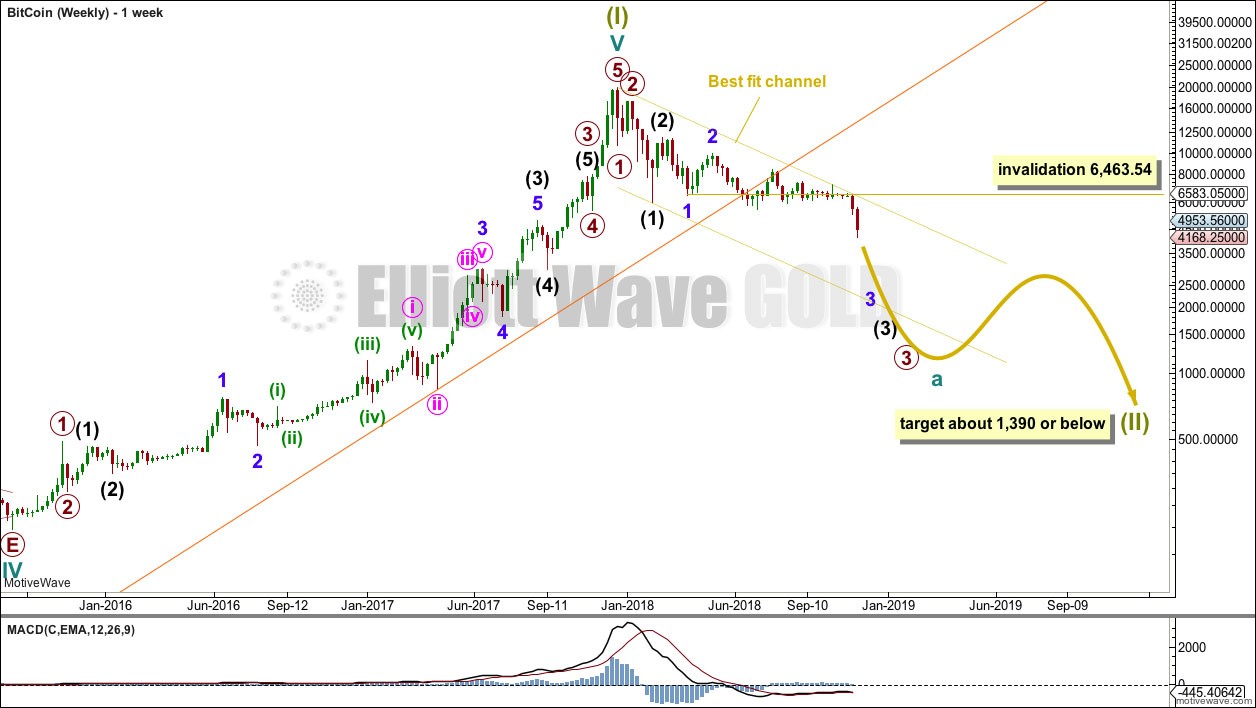
Bitcoin tends to behave like an extreme commodity: price moves upwards for about 2 – 4 weeks in a near vertical movement at the end of its rises. Following this vertical movement the resulting downwards movement is very deep (in percentage terms) and often very quick.
The next rise begins slowly with basing action over weeks or months, and then as the rise nears its end another vertical movement completes it. Also, there are volume spikes just before or at the end, which is another feature typical of commodity like behaviour.
This has happened now several times. The most notable instances are the rise up to the week ending 24th November, 2013, and the week ending 5th June, 2011. The following sharp drops were 94% and 93% respectively.
If this current drop continues like the last two examples, then a reasonable target may be about $1,390.94 or below.
Super Cycle wave (II) would most likely be a zigzag, but it may also be a flat, combination or triangle; a zigzag would subdivide 5-3-5. Cycle wave a should subdivide as a five wave structure, but so far that would be incomplete.
Within this five wave structure unfolding lower, minor wave 3 may now have moved through its middle. Minor wave 4 may not move back up into minor wave 1 price territory above 6,463.54.
When cycle wave a may be seen as complete, then a one to multi-year bounce or consolidation for cycle wave b may be expected. This may present a weak buying opportunity, but the huge variation in structure of b waves makes this extremely risky.
DAILY
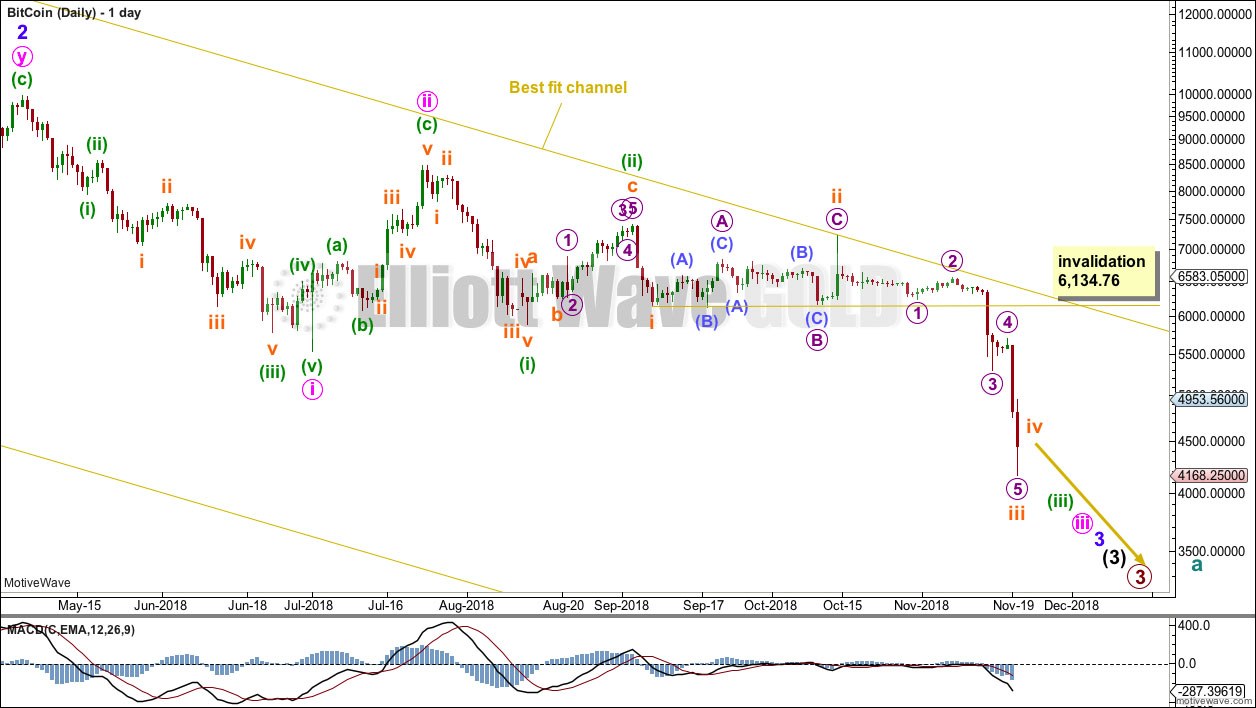
If Bitcoin is crashing, then a five down structure should develop at the weekly chart level. This would still be incomplete.
A third wave down may now be moving through its middle at six degrees. Bitcoin may be still winding up for a further spectacular plummet in price. The strongest fall may come towards the end of any one or more of these third waves as Bitcoin exhibits commodity like behaviour. Commodities tend to have their strongest portion of impulses in the fifth waves.
Within the middle of this third wave, subminuette wave iii may be either complete or close to complete. Subminuette wave iv may not move into subminuette wave i price territory above 6,134.76. Only when a clear bullish reversal pattern forms on the daily chart would a more time consuming bounce or consolidation be expected to interrupt this downwards trend. Today that is not present, so it seems more reasonable to expect this downwards movement to continue.
TECHNICAL ANALYSIS
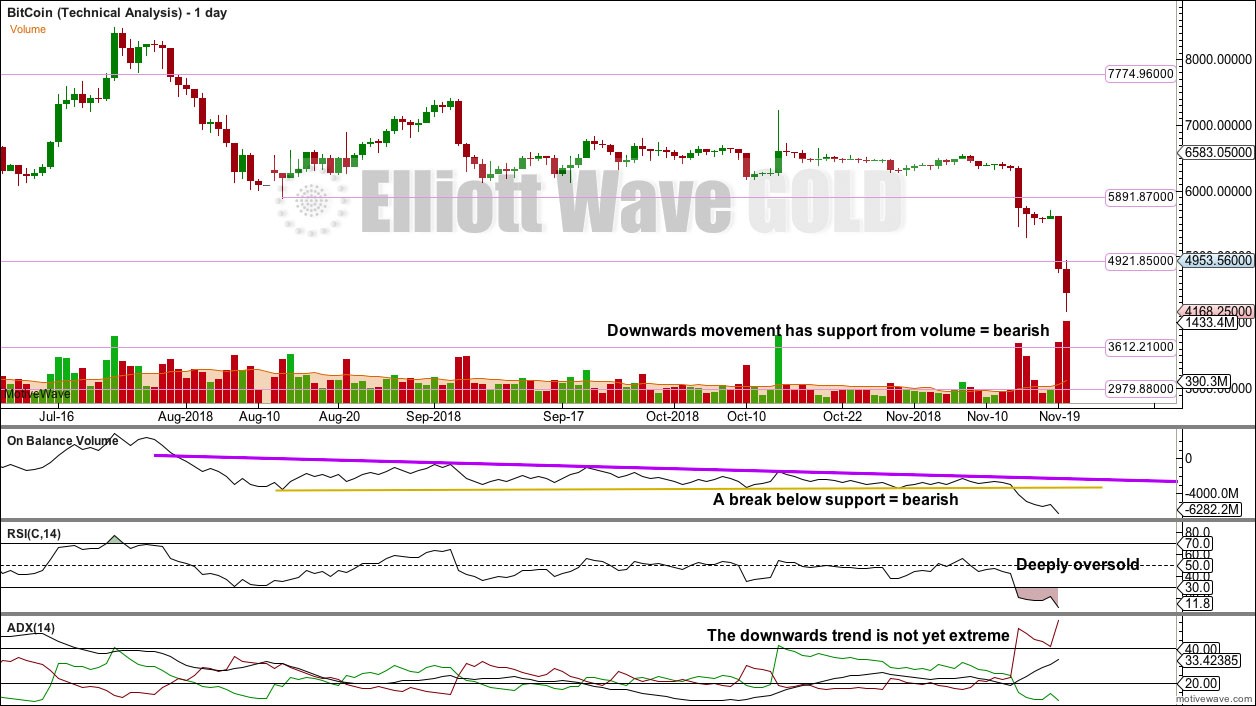
For the short term, support from volume is pushing price lower. This is very bearish.
The following can be noted when looking back at Bitcoin’s behaviour during its previous strong falls in price:
The 94% fall in price from June to November 2011 was characterised by:
– Three clearly separate instances of RSI reaching oversold on the daily chart, separated by bounces.
– ADX did not remain very extreme for very long at all on the daily chart.
– On Balance Volume exhibited weak single bullish divergence at the low.
The 93% fall in price from November 2013 to February 2014 was characterised by:
– RSI reached oversold and remained deeply oversold for three weeks; at the low there was only single weak bullish divergence with price.
– ADX remained very extreme for the last seven sessions to the low.
– At the low, On Balance Volume did not exhibit bullish divergence with price; it remained bearish and then exhibited further bearishness after the low as it continued to decline as price began to rise.
For the current fall in price, the current Elliott wave count expects the fall to be larger in terms of duration than the previous two noted here, and at least equivalent in terms of price movement in that a fall of over 90% is expected now. Currently, ADX is not yet extreme. RSI is now deeply oversold, but past behaviour indicates this may continue for some time. There is plenty of room for this downwards trend in Bitcoin to continue.
So far at the lowest low from the all time high Bitcoin has only retraced 0.79. While this is deep, its corrections are usually deeper than this.
Support below is identified on the chart.
Become a Successful Trader and Master Elliott Wave like a Pro. Start your Free 14 Day Trial at - Elliott Wave Forecast.
Author

Lara Iriarte, CMT
Elliott Wave Gold
Lara Iriarte is a Chartered Market Technician and a Registered Financial Advisor in New Zealand.


