|

BTC/USD technical analysis: There is another technical formation on the hourly chart

  • BTC/USD is down another 2.83% today after the major fall two sessions ago.
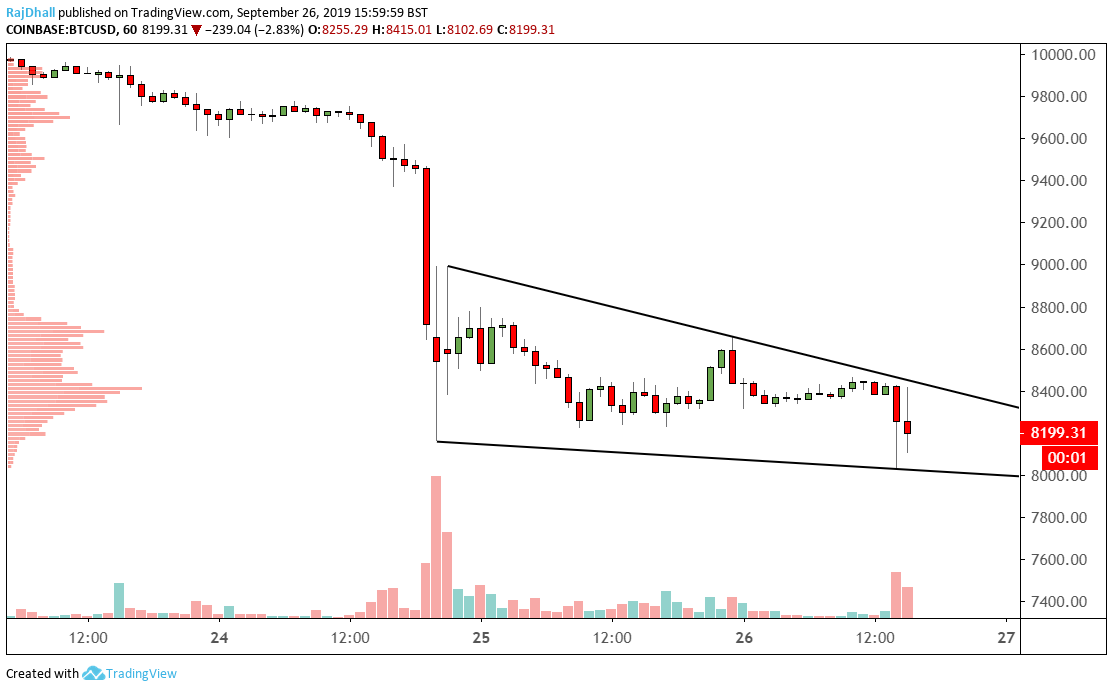
  • Now there is a falling wedge pattern on the hourly chart that could indicate which way price may turn.

The market found support at 8k today as the bearishness continued. 

After the fall two sessions ago the price has now consolidated into a falling wedge formation. 

Mean value is around 8,400 so if we see another rejection keep an eye on price action there.

Bulls are hoping for a break of the pattern high at 8,800 to signal a move higher. 

Bitcoin Analysis

BTC/USD

Overview
Today last price8196.34
Today Daily Change-239.37
Today Daily Change %-2.84
Today daily open8435.71
 
Trends
Daily SMA2010046.6
Daily SMA5010329.76
Daily SMA10010541.52
Daily SMA2008286.57
 
Levels
Previous Daily High8744.39
Previous Daily Low8209.57
Previous Weekly High10381.06
Previous Weekly Low9606.36
Previous Monthly High12325.08
Previous Monthly Low9321.06
Daily Fibonacci 38.2%8413.87
Daily Fibonacci 61.8%8540.09
Daily Pivot Point S18182.06
Daily Pivot Point S27928.4
Daily Pivot Point S37647.24
Daily Pivot Point R18716.88
Daily Pivot Point R28998.04
Daily Pivot Point R39251.7

Author

Rajan Dhall, MSTA

Rajan Dhall is an experienced market analyst, who has been trading professionally since 2007 managing various funds producing exceptional returns.

More from Rajan Dhall, MSTA
Share:

Editor's Picks

XRP holds $1.40 amid ETF inflows and stable derivatives market

Ripple trades under pressure, with immediate support at $1.40 holding at the time of writing on Tuesday. A recovery attempt from last week’s sell-off to $1.12 stalled at $1.54 on Friday, leading to limited price action between the current support and the resistance.

Crypto Today: Crypto market holds $2.4 trillion as bearish sentiment persists around Bitcoin, Ethereum, XRP 

The Crypto King, Bitcoin, is constrained below $70,000, with the price holding around $69,000. Altcoins, including Ethereum and Ripple, exhibit technical weakness but are holding above key support levels at $2,000 and $1.40, respectively.

Aster tests resistance as whale activity, perpetuals volume surge

Aster (ASTER) edges higher by over 7% at press time on Thursday, crossing above its 200-period Exponential Moving Average (EMA) on the 4-hour chart while testing a long-term resistance trendline on the daily.

Bitcoin slips below $69,000 as crypto market shows cautious stabilization

Bitcoin price is nearing the lower consolidation boundary, trading below $69,000 at the time of writing on Tuesday. A breakdown below this key level would suggest a correction toward $60,000. However, institutional and corporate demand support a short-term stabilization in BTC.

Bitcoin Price Annual Forecast: BTC holds long-term bullish structure heading into 2026

Bitcoin (BTC) is wrapping up 2025 as one of its most eventful years, defined by unprecedented institutional participation, major regulatory developments, and extreme price volatility.

Bitcoin: The worst may be behind us

Bitcoin (BTC) price recovers slightly, trading at $65,000 at the time of writing on Friday, after reaching a low of $60,000 during the early Asian trading session. The Crypto King remained under pressure so far this week, posting three consecutive weeks of losses exceeding 30%.