|

BTC/USD Technical Analysis: Bitcoin breaks above 200 SMA and finds resistance at 5,200.00 level

BTC/USD daily chart

  • BTC/USD broke above its 200-day simple moving average (SMA) suggesting a potential bull market in the cryptocurrency.

BTC/USD 4-hour chart
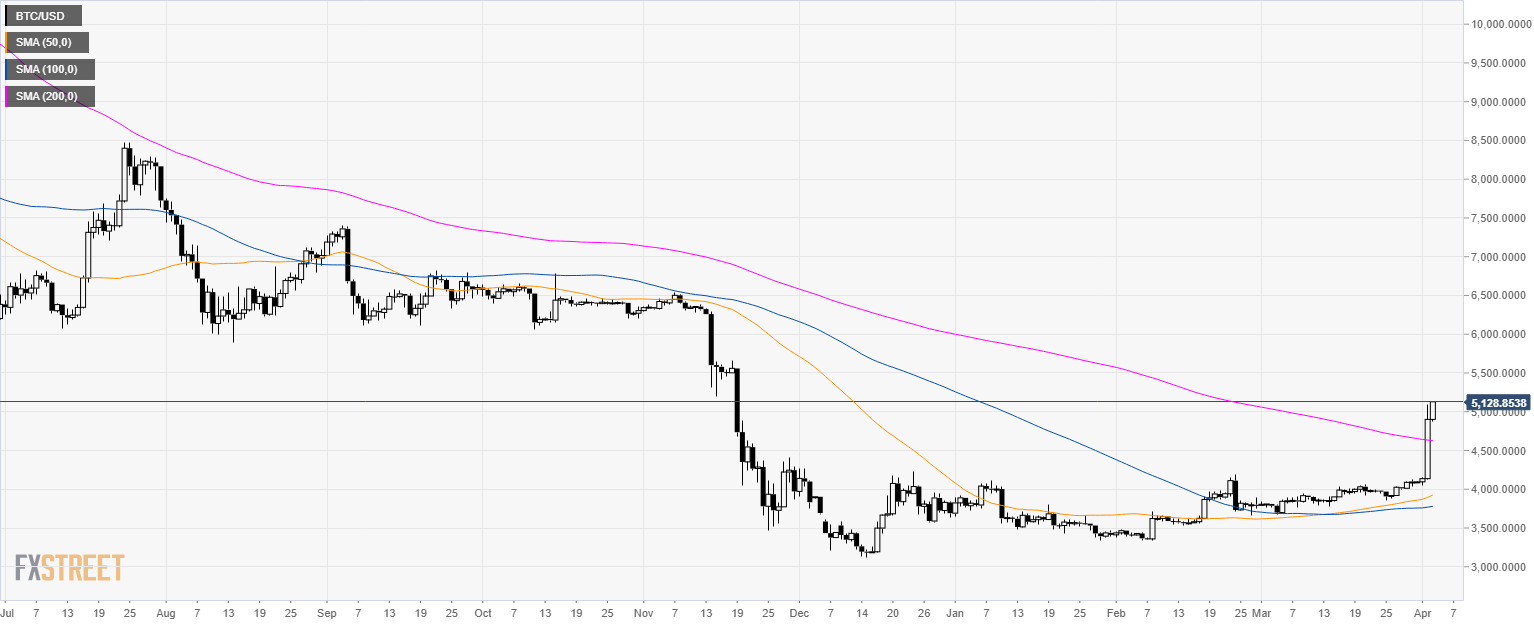
  • BTC/USD is trading above its main SMAs suggesting a bullish bias in the medium-term.
  • Bulls will need to break above the key 61.8% Fibonacci retracement at 5,200.00 to extend the trend towards 5,800.00 and 6,600.00 resistances.
  • Support is seen at 4,800.00 and 4,400.00 level.

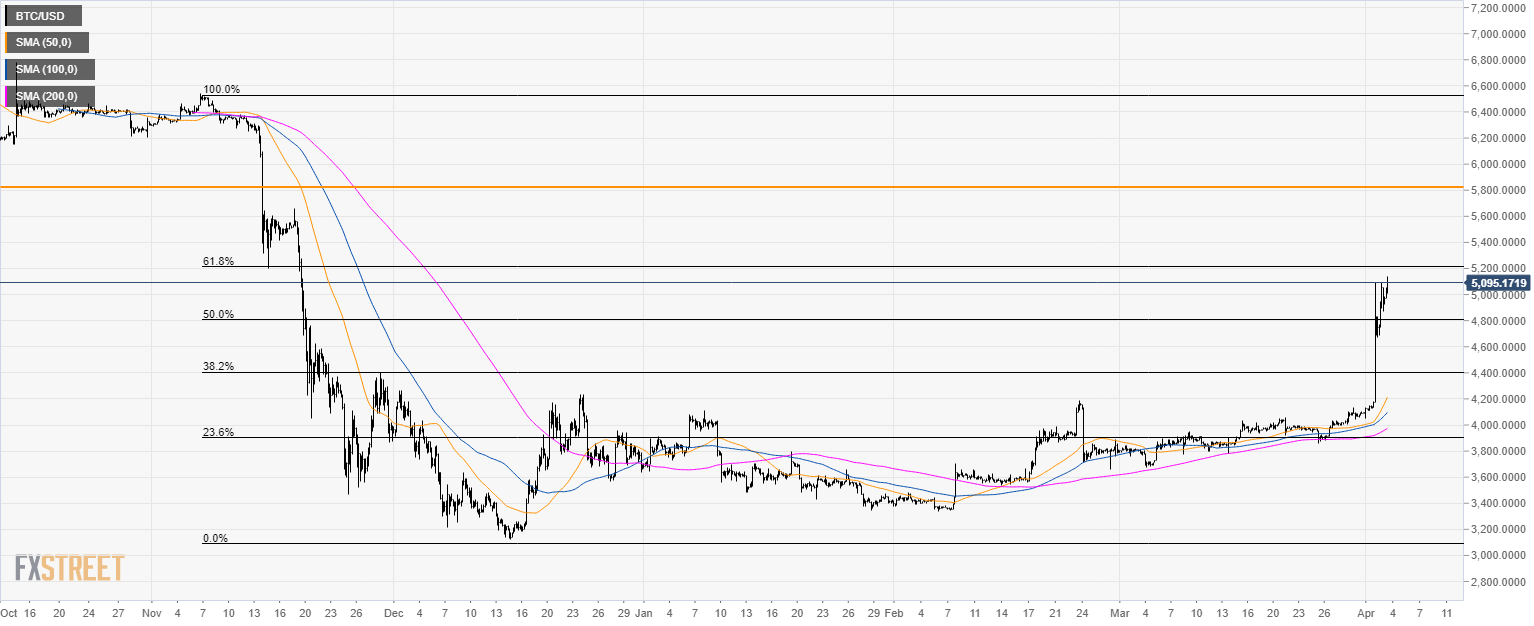
Additional key levels

BTC/USD

Overview
Today last price5148.52
Today Daily Change246.86
Today Daily Change %5.04
Today daily open4901.66
 
Trends
Daily SMA204040.32
Daily SMA503889.28
Daily SMA1003769.76
Daily SMA2004687.21
Levels
Previous Daily High5089.9
Previous Daily Low4132.18
Previous Weekly High4100.77
Previous Weekly Low3858.32
Previous Monthly High4130.71
Previous Monthly Low3672.34
Daily Fibonacci 38.2%4724.05
Daily Fibonacci 61.8%4498.03
Daily Pivot Point S14325.92
Daily Pivot Point S23750.19
Daily Pivot Point S33368.2
Daily Pivot Point R15283.65
Daily Pivot Point R25665.64
Daily Pivot Point R36241.37

Author

Flavio Tosti

Flavio Tosti

Independent Analyst


More from Flavio Tosti
Share:

Editor's Picks

Ripple extends losses as derivatives interest cools

Ripple (XRP) extends its bearish roll near $1.12 support on Friday, reflecting intense headwinds in the broader crypto market largely attributable to macroeconomic pressure.

Crypto Today: Bitcoin, Ethereum, XRP weaken further as capital outflows persist

Macroeconomic headwinds continue to weigh heavily on the cryptocurrency market on Friday, prompting major assets like Bitcoin (BTC) to pare earlier gains and extend losses after June’s brief relief rally.

Bitcoin Weekly Forecast: Recovery hopes fade after the Fed spoils the party

Bitcoin is set to end the week in the red, trading near the 200-Week Simple Moving Average at around $62,300 on Friday. Institutional selling persists, capping BTC’s recovery as spot Exchange Traded Funds point to a sixth consecutive week of outflows.

Sui risks a deeper bearish leg despite on-chain resilience

Sui is down 2% on Friday, extending its decline toward the recent support leg formed at $0.6618. The Total Value Locked in the Sui ecosystem has stabilized around 600 million SUI tokens, reflecting resilient user demand.

Bitcoin: Recovery hopes fade after the Fed spoils the party
Bitcoin (BTC) is set to end the week in the red, trading near the 200-Week Simple Moving Average (SMA) at around $62,300 on Friday. Institutional selling persists, capping BTC’s recovery as spot Exchange Traded Funds (ETFs) point to a sixth consecutive week of outflows.