BTC/USD made rally toward new all-time highs after double three pattern

In this technical article we’re going to take a look at the Elliott Wave charts charts of Bitcoin BTCUSD published in members area of the website. Our members know BTCUSD is showing impulsive bullish sequences in the cycle from the 50186 low. Recently, it made a clear three-wave correction. The pull back completed as Elliott Wave Double Three pattern and made rally toward new highs as expected. In this discussion, we’ll break down the Elliott Wave pattern and forecast.
Elliott Wave double three pattern
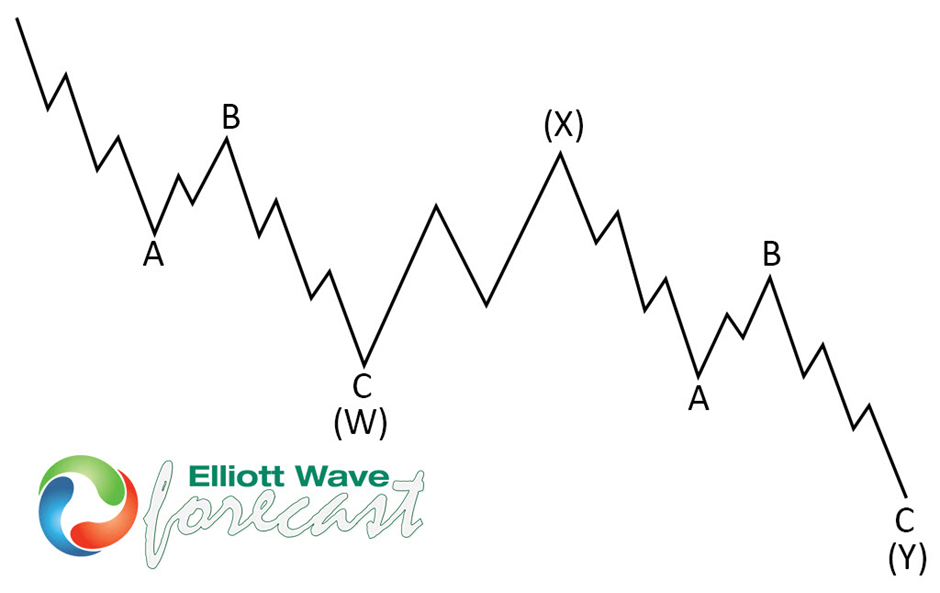
Double three is the common pattern in the market , also known as 7 swing structure. It’s a reliable pattern which is giving us good trading entries with clearly defined invalidation levels.
The picture below presents what Elliott Wave Double Three pattern looks like. It has (W),(X),(Y) labeling and 3,3,3 inner structure, which means all of these 3 legs are corrective sequences. Each (W) and (Y) are made of 3 swings , they’re having A,B,C structure in lower degree, or alternatively they can have W,X,Y labeling.
BTC/USD Elliott Wave one-hour chart 12.03.2024
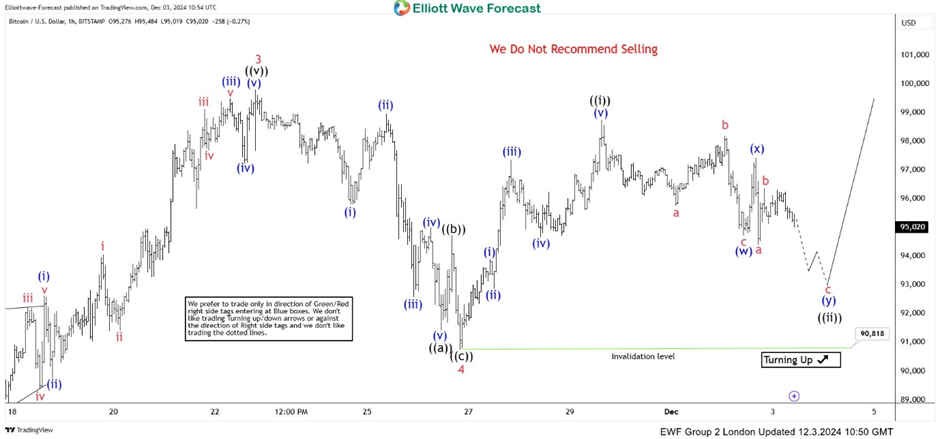
BTCUSD is giving us pull back against the 90818 low. The structure of this pullback is still incomplete at the moment, showing 5 swings down from the peak. The first leg, shows a clear 3-wave structure a,b,c red, followed by a 3-wave bounce in (x) blue. Wave (y) blue should also form a 3 waves pattern. We miss another swing down to complete clear 7 swings pattern in ((ii)) pull back. We advise against selling $BTCUSD and instead favor the long side. While the price stays above 4 red low: 90818, we expect to see further rally toward new highs.
BTC/USD Elliott Wave one-hour chart 12.03.2024
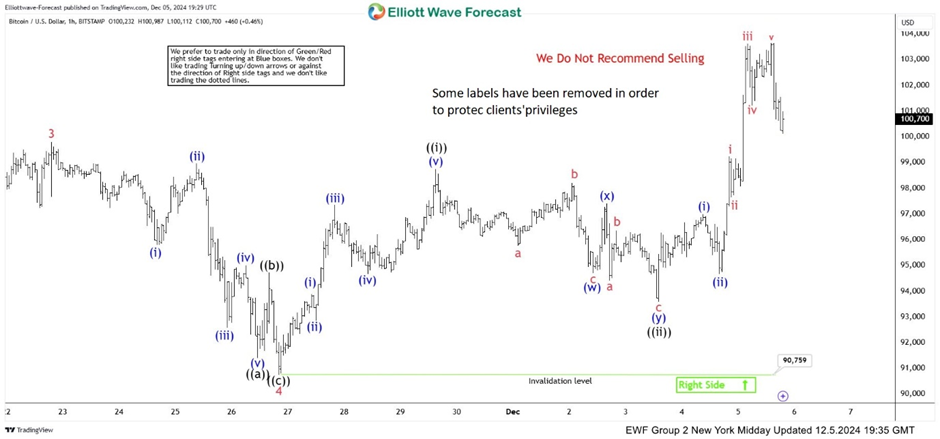
Bitcoin found buyers as expected. The crypto completed Double Three pattern and reacted strongly. Eventually we got a break toward new highs. Now, intraday pull backs should ideally keep finding buyers as far as 90759 pivot holds.
Author

Elliott Wave Forecast Team
ElliottWave-Forecast.com



